Charting: Overview
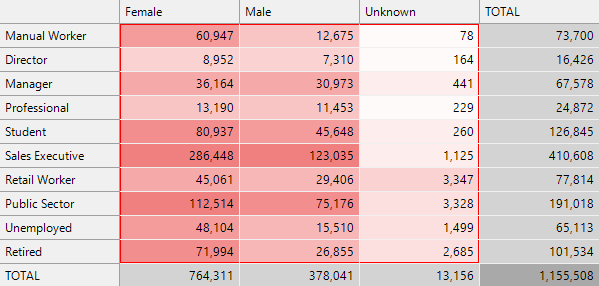
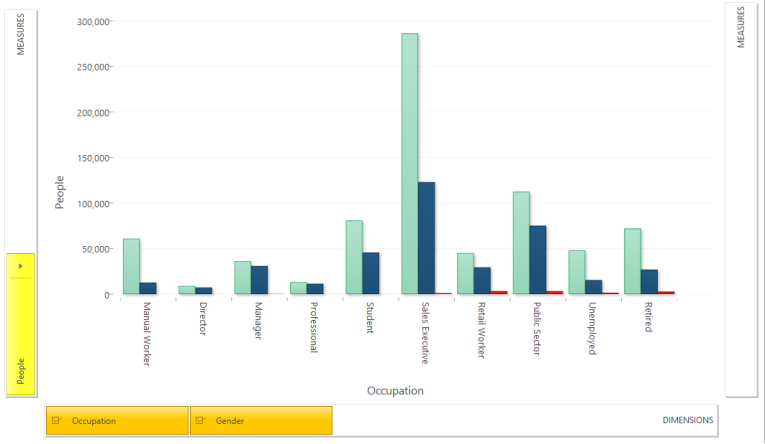
A chart is a graphical representation of a Cube (or a section of a Cube).

The default chart type is a Clustered Column Chart displaying a maximum of two dimensions at a time.

When should I use a Chart?
Use a Chart when you want to visually communicate the numerical analysis of a Cube.
Often a visualisation of data can illustrate things more effectively than plain numbers.