Cube: How do I apply Calculated Measures to a Cube?
This feature allows you to perform simple calculations in and between cells on a Cube or Tree and, where applicable, to additionally express Calculated Measures as a percentage.
In Cell Calculation
Example: Find the average number of bookings per customer by income band
-
Create a Cube set to the People table level and apply the Income variable to the vertical axis.
-
Drag the Bookings table on to the Cube.
-
Drag the sigma box from the horizontal axis onto the vertical axis to show the measures in the same cell.
-
Build to display the results.
_483x468.png)
To apply the settings for the calculation:
-
Click on the Statistics button followed by the Add Statistics… button.
A new radio button option - Calculated Measures - can be seen:
-
Mark this option.
_486x331.png)
An In-Cell Calculation will be performed here (which is based upon the intersection of the dimensions), best shown with the measures displayed in the same cell. Drop down lists are available for the Measures (as shown on the Cube) and Operators to be chosen for the calculation.
-
Set the options as follows and enter a name of Avg Bookings per Person.
_489x332.png)
-
Click OK.
_487x334.png)
The results of the calculation are displayed immediately on the Cube without the need to click the Build button.
Drag the sigma button back to the horizontal in order to see here a general trend where the higher the income band the more holiday bookings are made.
Further analysis can be applied using the existing Cube functionality. The screen shot below shows this information broken down by Gender and reoriented so the Avg Booking per Female/Male/Unknown can be examined side by side.
_493x390.png)
Between Cell Calculation
Example: Calculate the difference in the number of people booking holidays in a month compared to the previous month
To achieve this, I need to subtract this month's value from last month's value.
_496x356.png)
The screen shot above shows a Cube set to the People table level, with the Booking Date variable on the vertical dimension banded in months. The Booking table has been dragged on to the Cube and the Build button clicked to display the results.
To apply the settings for the calculation:
-
Click on the Statistics button followed by the Add Statistics… button.
A new radio button option - Calculated Measures - can be seen:
-
Mark this option.
In this example we are going to set a Between-Cell Calculation which we select from the Type drop down list.
More options have now appeared:
Cell: Contains a list of actions which will be restricted if you use a non-sequential variable
| This | Use the cells in the currently selected measure |
| Total | Use the total cell of the dimension |
| First | Use the first cell of the dimension |
| Previous | Use the previous cell to the one already indicated |
| Next | Use the next cell to the one already indicated |
| Last | Use the last cell of the dimension |
Dimension: A list of all items used on the dimensions can be selected from this drop down list. This is especially important if you are using the Previous or Next action so that you can determine if it is the column or row you are referring to.
Measure: A list of all measures used in the cube e.g. People, Bookings etc.
In our example we want to set the measure to People and set the calculation to be……. This cell – Previous cell. We only have the Banded Booking Date on the dimension so this is the only option. Name this statistic – Difference from previous month. Click OK.
In our example we want to set the measure to People and set the calculation to be……. This cell – Previous cell. We only have the Banded Booking Date on the dimension so this is the only option.
- Name this statistic – Difference from previous month.
_496x337.png)
- Click OK.
_496x301.png)
In the above screen shot we can see that 12,420 more people booked holidays in February 2011 than in January 2011.
Calculated Measures expressed as a Percentage
A Calculated Measure can be set to display in a Cube as a percentage. To illustrate this function, we will display the percentage of people who have booked holidays to the United States, broken down by the Income band to which they belong.
Open a Cube on a blank selection at the People table level.
Drag the Income variable onto the vertical dimension.
Right drag the People table from the System Tables onto the middle of the Cube.
Select Add Statistics.
Next create a People selection of those who have booked holidays to the United States and drag this selection onto the filtered by drop box within the statistics window.
.png)
Click OK.
In the Cube window, click on the Statistics icon and then Add Statistics.
Set the Statistics window as shown in the screen shot below.
Note: The Check box "as %" is what allows the calculation to be expressed as a percentage.
.png)
Click OK.
Build the Cube to display the results.
.png)
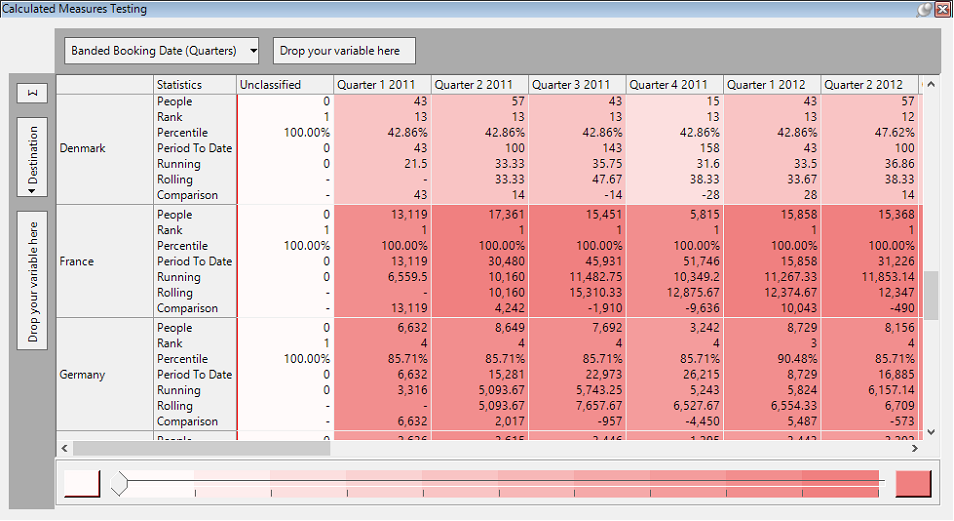
The following measures also allow for calculations to take place in a Cube or Tree. To demonstrate these:
-
Open a blank Selection window at the People table level
-
Drag on a Cube and add Destination and Banded Booking Date (Quarters) onto the dimensions
-
From the Statistics button click on Add Statistics and then check the Calculated Measures radio button
-
You will need to type a title in the Name box and select the function you want to use from the Type box
Rank
This function will sort and rank the values across a single dimension.
.png)
In the above example each Destination will be ranked in descending order by the number of People associated with that Destination. Numbers of equal value will be displayed according to the strategy option you select.
N.B. Screen shots of this function (and the others) applied to a cube are shown in Results below.
Percentile
This function operates in the same way as Rank but will return a percentage figure that shows into which percentile a value falls.
.png)
In the above example each Destination will be ranked in descending order by the number of People associated with that Destination. The percentage figure displayed is calculated as described above.
Period to Date
This function will only operate on a date dimension that will allow calculations on a date period.
.png)
In the above example each cell will show the cumulative total of people from the start of that year e.g. the result shown in cell Q3 2014 will be Q1 2014 + Q2 2014 + Q3 2014.
The date bands used will determine the ‘from the start of this’ options e.g. if you display the cube as banded Months the options will be Months, Quarters or Years.
Running
This function allows you to work out a running value across a dimension.
.png)
In the above example each cell will show the cumulative number of People divided by the number of cells up to that point. (N.B. Be aware that your Unclassified category may be hidden.)
E.g. the figure shown in Q2 2011 is calculated as follows:
(Unclassified Value + Q1 2011 Value + Q2 2011 Value)/3
Rolling
This function allows you to work out a rolling calculation across a dimension.
.png)
In the above example each cell will display the average number of People based upon that cell and the 2 previous cells.
E.g. the figure shown in Q1 2012 is calculated as follows:
(Q3 2011 Value + Q4 2011 Value + Q1 2012 Value)/3
Comparison
This function allows you to make a calculation making reference to a relative cell on this dimension.
.png)
In the above example the value calculated will be the difference in the number of People of this Quarter compared to the previous Quarter. The options allow you to vary the number of periods before or after to which you want to compare as well as the time period if a date variable is used e.g. to 1 Year before. Alternatively you can set a fixed value (cell) to which you want to make all comparisons.
Rather than find the actual value difference you have the option to find the value as a Ratio or as a % Difference.
Results
The following screen shots will allow you to check the figures generated based upon the calculated measures described above.
.png)