Cube with selections
Selections can be dragged onto a cube dimension drop box. By default, when a selection is dragged on, the cube will be broken down into two categories, records that are in the selection and records that are not.
For example, if a cube is created and the Income Band variable is added, a frequency table is generated showing how many people are in each Income Band.
.png)
If a selection of people born before 1960 is added, this will now break down the table by this selection.
.png)
A single dimension can also have multiple queries added to it. Because in general two selections can both select the same records, you can choose whether you want to see the selections overlap each other (providing results that would look similar to a flag array selector variable) or whether the selections should be "de-duplicated". De-duplicating selections means that if a record is selected by one selection, then it will not be counted in the figures for all subsequent selections.
Sets of multiple selections are created by creating a cube and dragging on one selection.
.png)
In this example, the query was of people with a high income (£60k or above). Then a second selection was made (of people with an occupation of "Director") and this was right-dragged onto the first selection. Options are given to replace the High Income query with the new Directors query (which would produce another Yes/No cube) or to add the query to the existing set in an overlapping, de-duplicating, cumulative or compound manner.
.png)
If the Overlapping option is chosen, the following cube is generated.
.png)
Then other selections can also be added to the cube by left dragging and this will give a display of cells showing the count for each selection.
.png)
Note
Multiple selections can be dragged onto a cube in one go to create a query set dimension. Navigate to the File Explorer window and use Shift or Control and left click to select the required selections. Click on one of the highlighted selections and left drag onto a cube axis to insert the selections with the default overlapping option, or right drag in order to select from the drop down menu options:
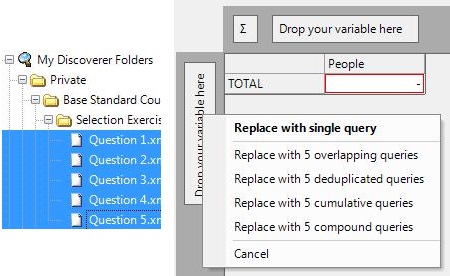
The settings for this dimension can be modified by right-clicking on the dimension and choosing the Edit... option. This brings up the Edit window:
.png)
Using this window, the order of the queries can be changed and the dimension can be changed between overlapping, de-duplicated, cumulative or compounded.
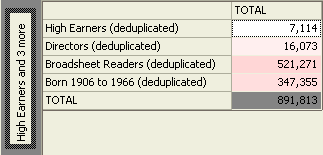
A cell using the de-duplicated display shows the count of that selection with any duplicate records from the previous cell(s) having been removed.
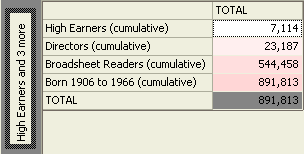
A cell using the cumulative display adds any new records in a cell with those from the previous cell(s).
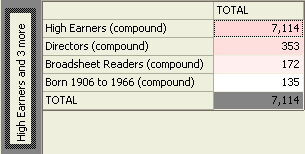
A cell using the compound display only shows the records in a cell where the record meets the condition from the previous cell(s). e.g. the 172 Broadsheet Readers are also Directors and High Earners.
Queries added as statistics
You can add queries to the main body of a cube as a statistic, as opposed to just on a dimension, and then use such statistics to carry out further analysis.
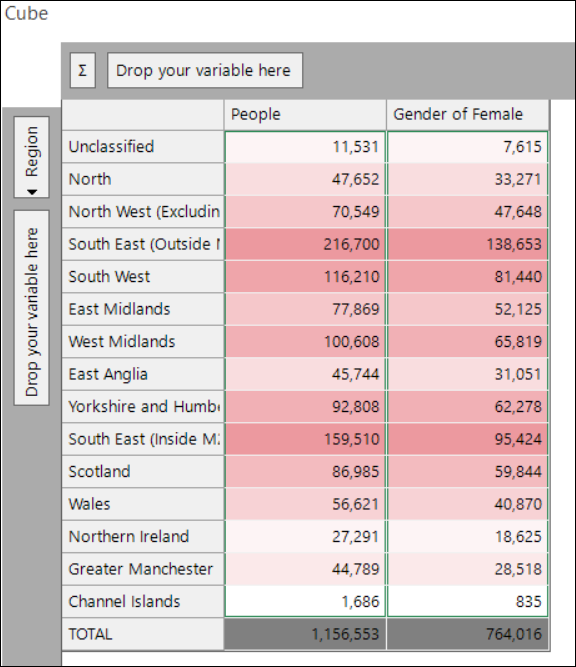
The example below demonstrates how to establish the proportion of the database which is female, broken down by the region in which they live.
To start:
- Create a selection of people whose gender is Female.
-
Create a cube with Region on the vertical dimension and then drag the Female selection onto the main body of the cube and build the display.
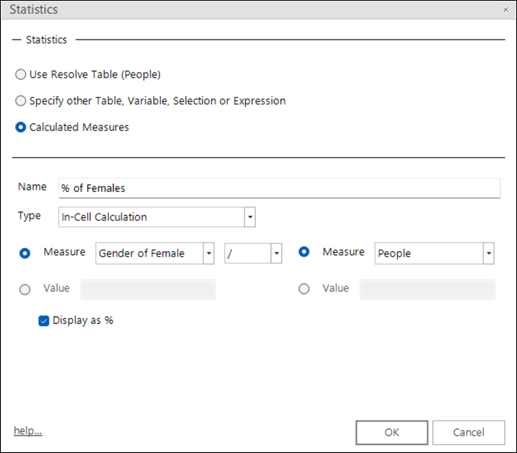
To calculate the percentage of females:
- Click on the Statistics button and select Add Statistics.
-
Complete the statistics dialogue box, as follows:
-
Click OK and then build the cube.
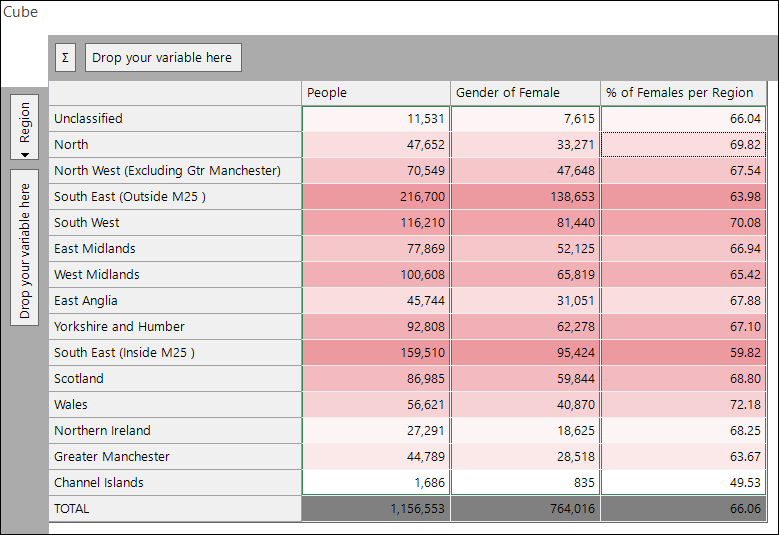
The results indicate, for example, that females represent 72.18% of those on the database living in Wales.
To add multiple categories from a single selector variable into your cube as query statistics:
-
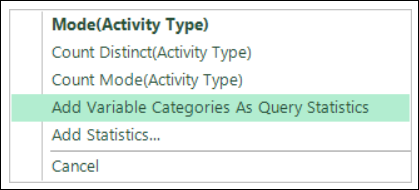
Right-drag the selector variable into the middle of the cube display and select Add Variable Categories as Query Statistics.
-
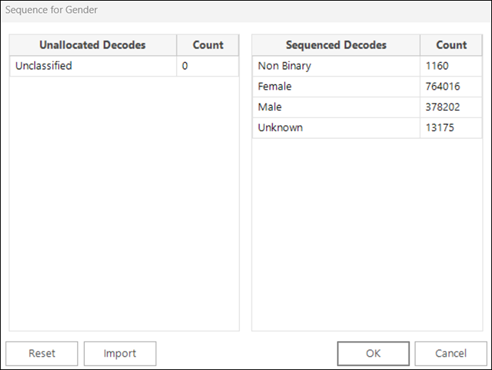
Select and double-click to move the required categories from Unallocated to Sequenced.
-
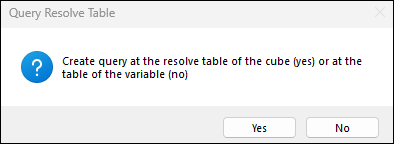
Select OK. You have the choice to add the query statistics at the same table level as the cube, or at the table level of the variable itself.
-
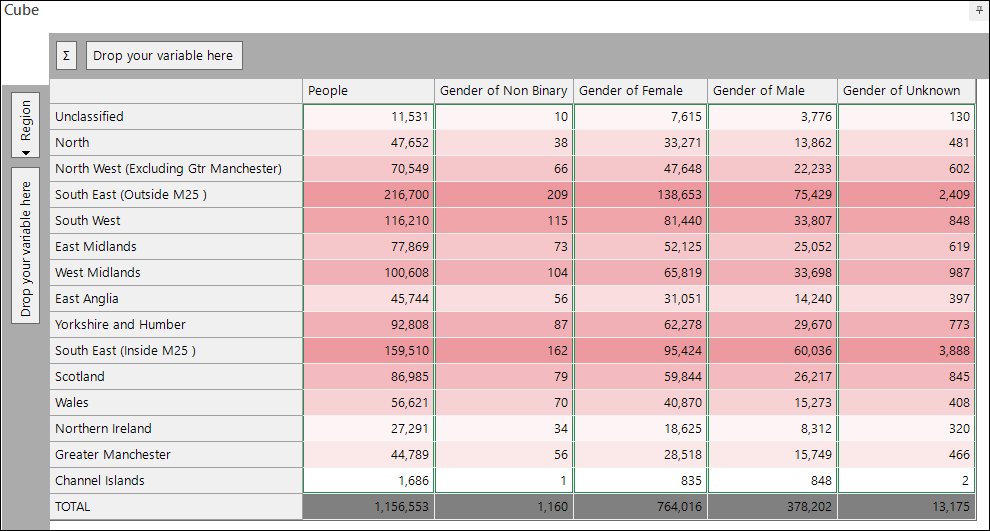
Build the cube.
Note
When displaying transactional variable queries on a person-level cube, the count of the individual categories may not equal the count of people, since a person can have multiple transactions as well as transactions in more than one category.
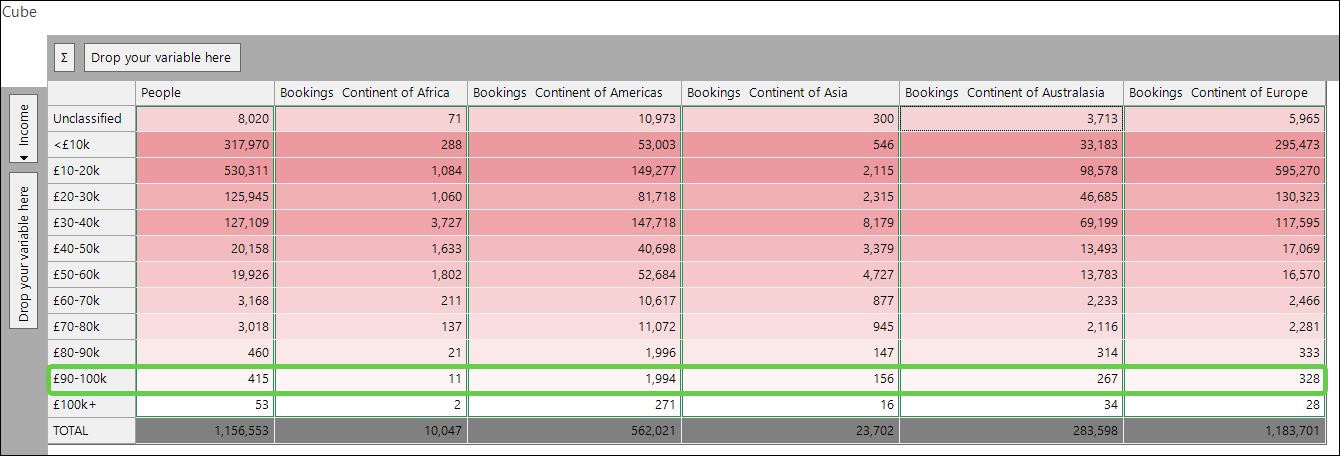
The cube column headers clearly display the selected level, variable, and category.
Example
The row highlighted in the cube below indicates that for the 415 people earning £90-100k, there are 11 people with bookings to the continent of Africa, 398 to the Americas, and 146 to Asia.
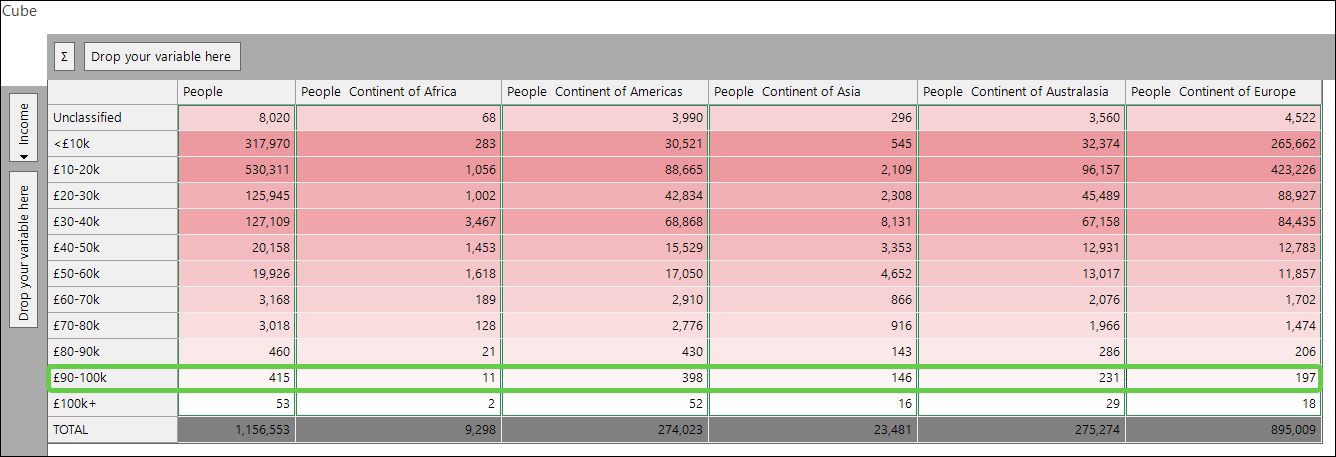
The following cube highlights the number of bookings made by the same 415 people in the £90-100k income range.