Expressions: Aggregations on the fly - Value
Scenario 1
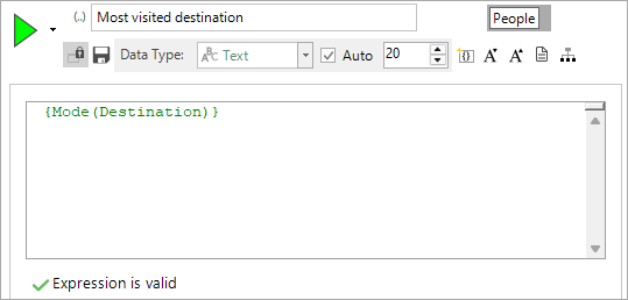
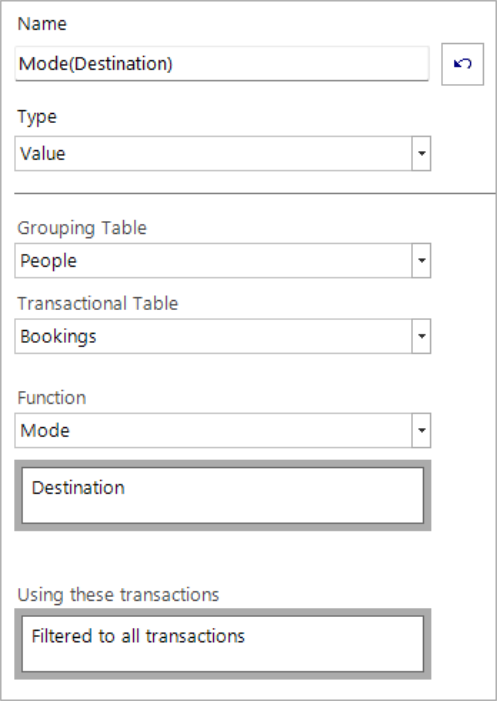
Which destination has a person visited the most?
-
Click on the
.png) Add Aggregation button.
Add Aggregation button. -
Click on the tab entitled FrequencyBookings and change the Type box to show Value.
-
Set the Grouping Table to People and the Transactional Table to Bookings.
-
Drag the Destination variable on as the value variable and leave the default Mode as the Function.
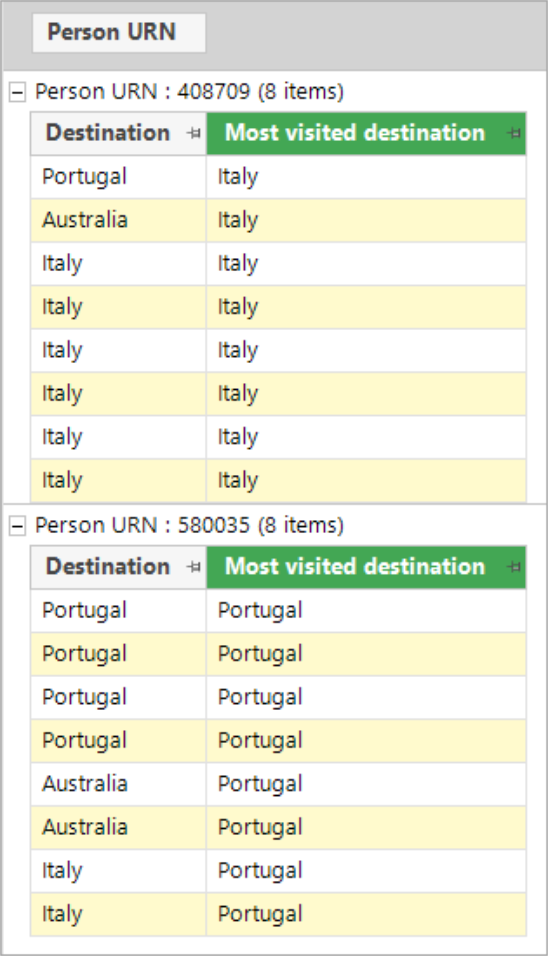
A data grid can be used to validate the results:
Using a selector as the value variable results in a subset of relevant functions being presented. As well as the mode function, you can select from:
-
Count Distinct - used to establish e.g. how many distinct destinations a person visited
-
Maximum Distinct Count - used to establish e.g. how many times a person has been to their favourite destination
When using a numeric or currency value variable, a more extensive list of functions can be accessed.
Scenario 2
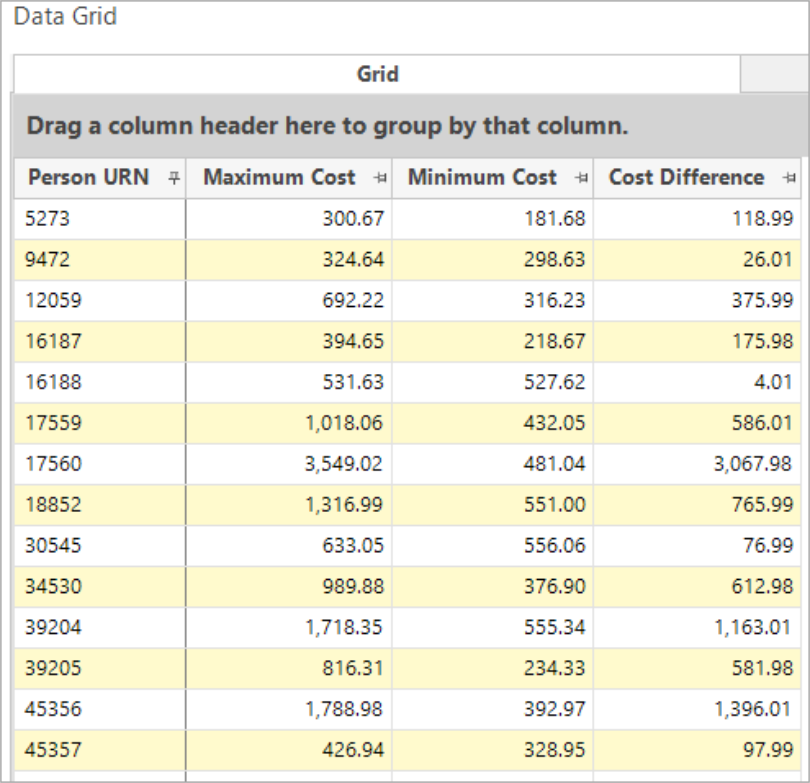
What is the difference between each person's maximum and minimum cost of a booking?
.png)
-
Click on the
Add Aggregation button. -
Click on the tab entitled FrequencyBookings and change the Type box to show Value.
-
Drag the Cost variable onto the Function drop box and change the function to display Maximum.
-
Click on the Expression tab and enter a minus sign after the aggregation title.
-
Click on the
Add Aggregation button to generate a new aggregation tab. -
Click on the tab entitled FrequencyBookings and change the Type box to show Value.
-
Drag the Cost variable onto the Function drop box and change the function to display Minimum.
_871x596.png)
-
Click the Build button to see a preview of the results.
A data grid can be used to validate the results:
Scenario 3
Added in Q4 2025
Use the linear trend value function to examine the sequence of transactions of an individual and identify those whose booking cost values are increasing the most over time.
-
Create a new Value on the fly aggregation and select Linear Trend (slope) as the function.
-
Drag and drop Cost as the value variable and order the records by Booking Date.
You can optionally filter the transactions to, for example, bookings made only in the last year, or to a particular destination. In this example, we will return all bookings.
-
Name the expression - LinearTrendCost.
A data grid can be used to validate the results:
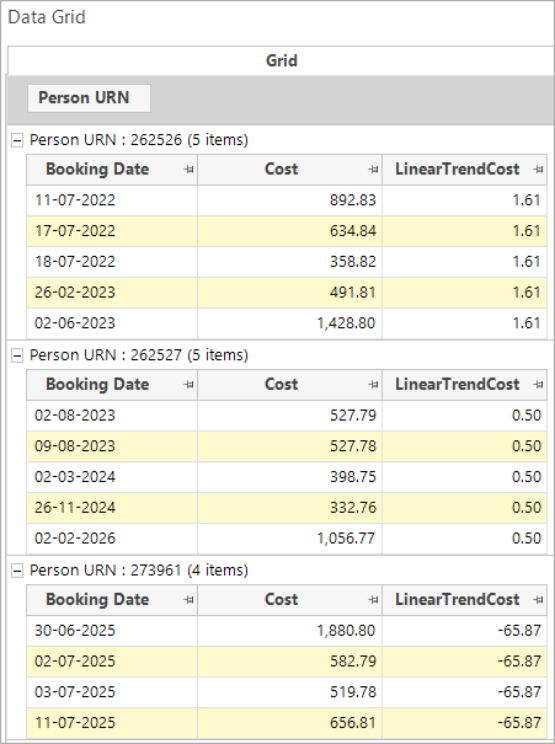
Person URNs 262526 and 262527 both demonstrate a positive linear trend booking cost over time of £1.61 and £0.50 per day respectively, whilst Person URN 273961 displays a significant decrease of £65.87.
Grouping the display by LinearTrendCost allows you to more easily see those with the smallest or greatest values:
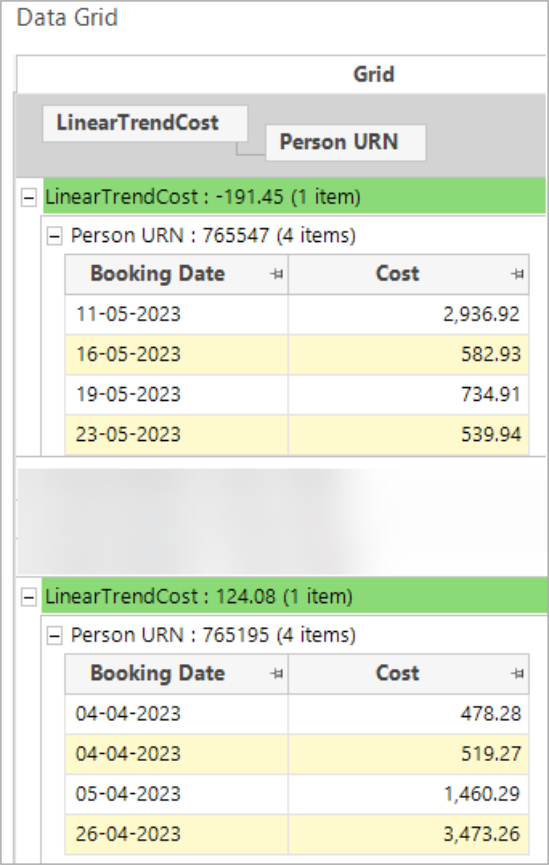
The values can be validated using online best fit calculators. Dates need to be converted into numbers for this purpose.
Click to return to Expressions: Aggregations on the Fly