Expressions: Aggregations on the fly - Category Grouping
The 'on the fly' Category Grouping aggregation allows you to group the transactions of a selector variable into categories, before applying a function to each of the transactions, and summarising the results for each group. There are numerous ways in which to combine parameters to answer a range of analytical questions, such as:
-
What is the most a person has spent in a single department?
-
On which product has a person spent the most?
-
On how many products has a person spent more than £1000?
-
In which product category does a person have the fewest transactions?
-
How many events has a person attended multiple times in multiple years?
The starting point in all cases is:
- to group by a transaction level selector type variable - e.g. holiday Product from the Bookings table
- apply a function to each transaction in each group before summarising the results to get a single value for each category grouping - e.g. Sum(Cost) of bookings for each different holiday product a person has purchased
- select and return a specified value across all groups - e.g. Maximum – to identify the most a person has spent on a single holiday product
Added in Q2 2025 - Ability to combine the power of Category Grouping with Pattern Match - see Expressions: Aggregations on the fly - Category Grouping with Pattern Match
Example 1: On which holiday product has a person spent the most?
In a new Expression window:
-
Click on the
 Add Aggregation icon
To access the ‘on the fly’ options:
-
Click onto the Frequency(Bookings) tab and from the Type drop-down select Category Grouping
-
Select the appropriate Transactional (e.g. Bookings) and Grouping (e.g. People) tables
-
Drag and drop the Product variable onto the Group transactions by drop-box
-
From the To each group apply the function drop-down, select Sum
-
Drag the Cost variable onto the Drop your numeric variable here drop-box
-
Click onto the From the group results return the… drop-down and select Maximum
The results can be verified using a Data Grid:
.png)
We can see that Person URN 3942 has spent most on Flight Only bookings, whilst 6321 and 9383 have spent most on Package Holidays.
Where there are only a few groupings, it is relatively easy to work out which category the result refers to, but where you have many possible groupings, we can expand upon the above analysis and introduce functionality akin to that traditionally achieved using the Recency wizard in FastStats. This allows us to create groupings and then ‘Select Nth’, for example the 1st, 2nd, 3rd biggest/smallest value. We can return the result, either as a value or its corresponding category.
Example 2: On which holiday product has a person spent the most?
Here – whilst the question remains the same, how we create and display the results differs. Create your Category Grouping ‘on the fly’ expression as above, but:
-
From the group results return the… drop-down, Select Nth
.png)
By default, FastStats will select the largest value and return it as a numeric. Amend the defaults using the drop-down menu options.
.png)
If, for example, there are only 3 groupings, but we ask for a 4th value or category to be returned, FastStats will return a missing value or unclassified category - see screenshot below
_809x121.png)
Selecting to return the category creates a selector object and Text data type expression. We can therefore apply selector expression functions to the resulting aggregation, or convert it using string functions.
Use case
The above functionality might be used to establish an individual’s top 3 destinations visited so that corresponding images can be included and used to personalise your marketing communication.
Example 3: Find all holiday destinations where a person has spent more than £600
To look for results of grouping calculations which fall between a minimum and maximum value, we use the In Range function. Create your Category Grouping ‘on the fly’ expression as above, but here:
-
From the group results return the… drop-down, select In Range
-
Check the box for Minimum Value of Sum() and enter 600
In this example, we do not need to set a maximum value and, therefore do not need to check the Maximum Value box.
.png)
You can set:
-
a minimum value without a maximum value
-
a maximum value without a minimum value
-
set both values
-
set neither value
Setting neither value results in an ‘on the fly’ aggregation that is exactly consistent with the values returned when using the Transaction Summary wizard – i.e. there are no restrictions on the result of the numeric function and a list of all possible groups is generated.
FastStats returns a text data type expression – a flag array – set by default to “code of” which displays as a sequence of 0s and 1s:
.png)
More typically we change this to DescOf or Populated to return a more meaningful result. In the Expression window:
-
Switch to the Expression tab and amend the expression to include the DescOf function
_754x19.png)
-
Update the name of the expression and add to the Data Grid
You may need to adjust the expression default to display the text results in full
_680x50.png)
-
Repeat the process using the Populated function
_755x18.png)
.png)
Using the In Range function, let’s widen our focus and consider:
Example 4: Identify the customers who have the highest number of different destinations visited where the total spend on each of those destinations is over £1000
-
Create and name the ‘on the fly’ aggregation shown below
.png)
-
Open a new Person level Cube and add the expression as a vertical dimension
-
Right-click on the dimension and create Simple Banding from 1 – 8 (8 being the maximum number of bookings any person has in the Holidays database)
.png)
-
OK and Build the Cube
.png)
There are 5 people on the database who have bookings to 5 different holiday destinations where the sum of the cost of bookings to each destination is greater than or equal to £1000. We can drag this cell from the Cube to create a new selection and use a Data Grid to verify the results:
.png)
Example 5: Find destinations which have more than 1 booking in 2 or more years
Further capability for Category Grouping ‘on the fly’ aggregations combines the ability to group and return In Range values with the Frequency function.
In this way, a retail analyst might, for example:
-
cross tabulate two different product types, or
-
look at product type against a banded date variable (year, week, month or day) to identify recent and frequent buyers in multiple categories – e.g. find people who have bought a particular product twice a week every week or twice a week in more than 10 weeks of a year, etc.
Those working in the charity sector might want to identify regular donors in terms of numbers and across different date periods.
Let’s imagine that we want to identify people in our Holidays data set who have made at least 2 bookings to a destination in at least 2 different years.
When applied as the first function in a Category Grouping ‘on the fly’ aggregation, “frequency” relates to the frequency of transactions. For example, if a person has made the following bookings – US, US, Australia, Australia, Australia, France – we can see there are 3 groups:
-
(US, US) – 2 transactions
-
(Aus, Aus, Aus) – 3 transactions
- (France) – 1 transaction
If we ask FastStats to return the Maximum from these group results, it returns a value of 3, corresponding to Australia.
In addition to calculating the frequency of records in a group, it is possible to calculate the frequency of a selector variable - for example, to find Frequency of Booking Year across all the transactions in a group. Consider:
| Destination | Booking Years | |
| US | = | 2016, 20166, 2017, 2018, 2019 |
| Australia | = | 2016, 2016, 2017, 2018, 2018, 2019, 2019 |
| France | = | 2016, 2017, 2017, 2017, 2018 |
If we want to find destinations that have had more than one booking, based on the above, we have:
| US | = | 2016 (2 bookings) |
| Australia | = | 2016, 2018, 2019 (2 bookings in each year) |
| France | = | 2017 (3 bookings) |
As we only want to return a destination when there have been at least 2 bookings in at least 2 years, the only destination that satisfies our criteria is Australia with 2 bookings in each of 3 different years.
Let’s consider this example in FastStats.
-
Create a new ‘on the fly’ aggregation and select Category Grouping, aggregating from Bookings up to the People table.
The selector variable we choose is the same one we wish to see in the results of our analysis – in this case we want to know which destinations have been visited at least twice and in at least 2 years.
-
Drag Destination onto the Group transactions by drop-box
-
From the To each group apply the function drop-down, select Frequency
-
Drag and drop the selector variable Booking Year onto the drop-box
We now have the In Range options to define but, rather than just one set of Minimum and Maximum ranges to define, we have two. The first allow us to determine how many per Booking Year group we want – in this example – more than 1 booking, so:
-
Set the Minimum Value Per Booking Year as 2
The second set allows us to determine how many years we want a minimum of 2 bookings to appear in – in this example, at least 2 years:
-
Set the Minimum Number Of Booking Year as 2
In both cases, no maximum is required.
Before we drag the expression onto a Data Grid, to output the category description rather than the code:
-
Switch to the Expression tab and add the DescOf function:
_779x56.png)
Use a Data Grid to verify the results:
.png)
Added in Q4 21 - Category Grouping new return functions
From the Q4 2021 release of FastStats, two further return functions are available:
-
Return Group Results
-
SelectNthByOrder
Example 6: Compare this transaction value to the total value of the group of this type of transactions
The Return Group Results option returns results on the transaction table rather than the parent - e.g. Bookings rather than People.
-
Create the on the fly aggregation shown below:
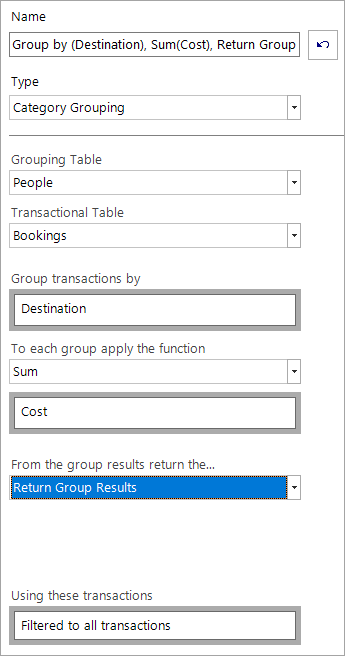
When you switch to the Expression tab, notice the warning that the Expression is currently set at the wrong table level:
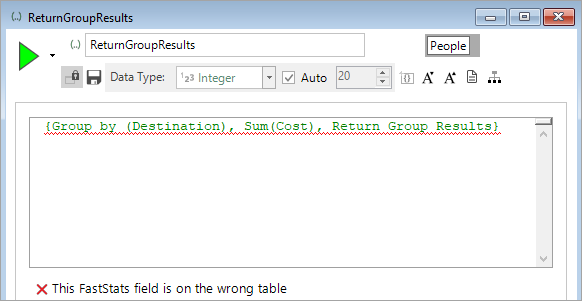
-
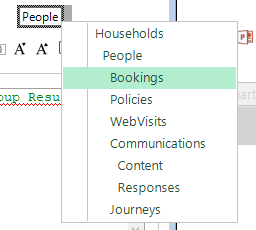
Right click and change the table from People to Bookings
The Expression is now valid:
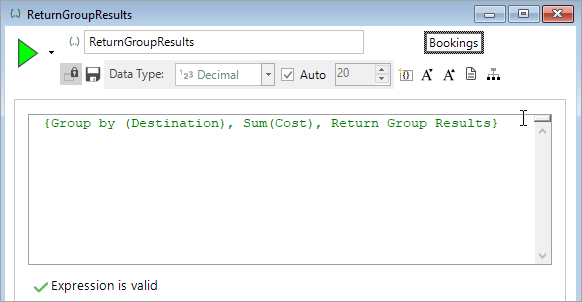
-
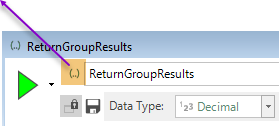
Name the Expression - e.g. Return Group Results
-
Drag and drop the Expression onto a Data Grid and build to verify the results
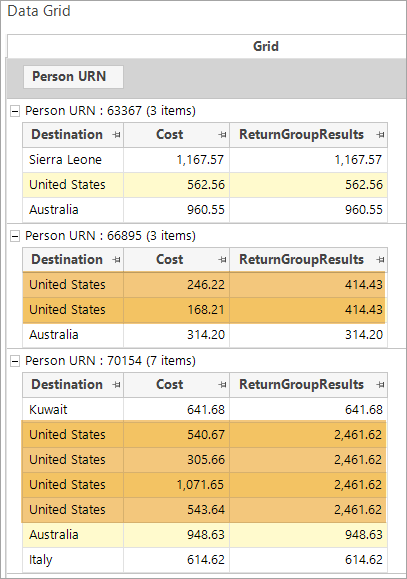
Based on our settings, you can see that FastStats displays each individual transaction a person has made and, where a person has booked to the same destination multiple times, the sum of cost of the bookings in that group is returned.
You can easily duplicate and edit the on the fly aggregation and add further information into the display - for example, to show the average booking cost for each Destination group:
-
Drag the original Expression by its drag handle and onto the workspace
-
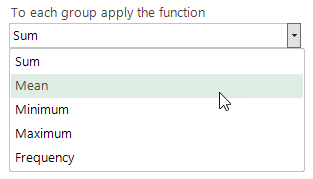
Switch to the aggregation tab
-
Change the function to Mean
-
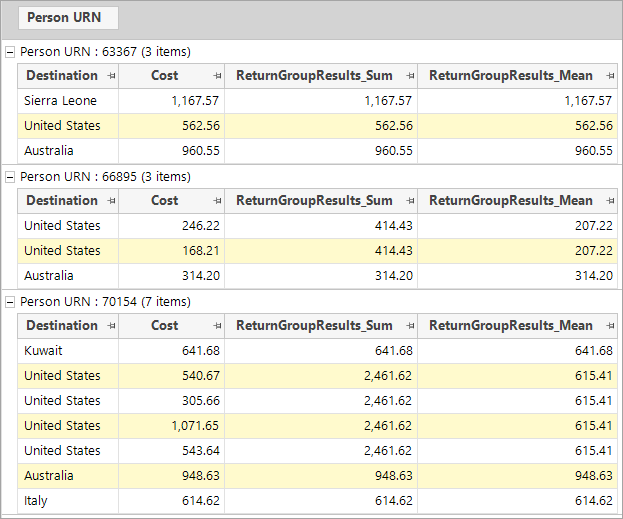
Rename the Expression - eg. Return Group Results_Mean
-
Drag and drop the Expression onto your Data Grid and rebuild
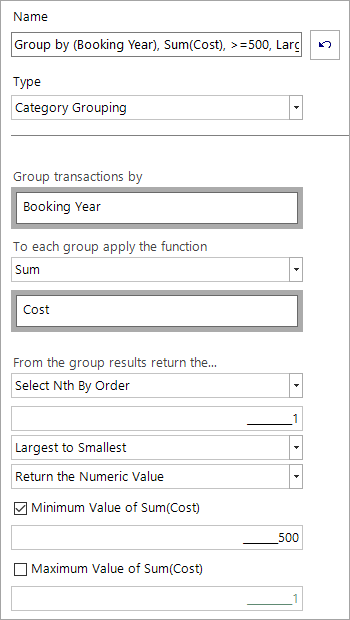
Example 7: What was the last year in which a person spent more than £500?
The option to Select Nth By Order can be used when the variable selected to group the transaction is an ordinal variable - in the following example this is Booking Year.
First consider the following Data Grid display where, for each holiday booking transaction a person has made, you can see the Booking Year and Cost.
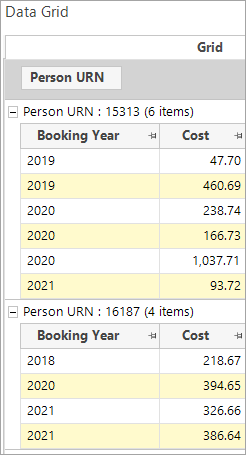
Person URN 15313 has made 6 bookings in total in 3 different years - we want to know the last year in which they spent £500 or more in total. The same is true for Person URN 16187 who has made 4 bookings across 3 years.
-
Create the on the fly aggregation shown below:
-
Name the Expression and then drag and drop it onto your Data Grid and rebuild
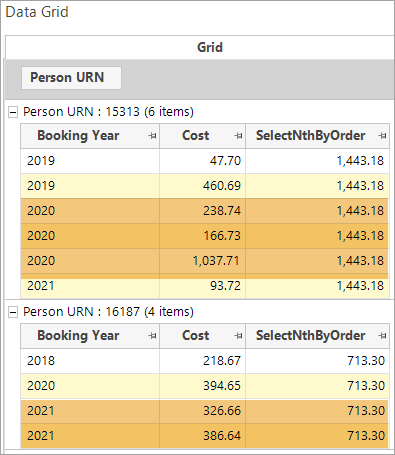
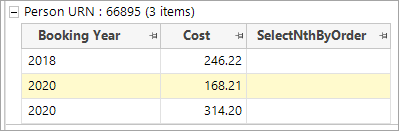
You can now see that for Person URN 15313 - whilst they have spent over £500 in two different years - the last year that this was the case was in 2020. For Person URN 16187, it was only the case in 2021. If none of the groups matches the criteria, a missing value is returned.
Previously, this kind of insight could only be achieved by creating and combining multiple Virtual Variables and, for systems containing high volumes of transactions, the ability to create Category Grouping ‘on the fly’ aggregations facilitates even faster and more powerful data analysis.
Click to return to Expressions: Aggregations on the Fly