Behavioural Modelling Development Update - Q4 2022
This release extends the functionality for visualising and identifying a diverse set of predictive features for use in a data model. This includes:
-
Negative Niche Features - features which apply to a few customers but give a strong indication of being a poor prospect.
-
Insight and Non-insight Categories - all categories of a dimension are now described as either ‘insight categories’ or non-insight categories’.
-
Insight PWE – to supersede “Uplift PWE”
-
Insight Coverage – provides an indication of the number of people for whom a dimension can give a significant and sizeable prediction.
-
Insight Type – all features are now assigned an insight type based on the nature of the insight they provide.
-
Insight columns - you can view the above concepts and measures as columns in the dimensions panel
The Insight definitions described and used for behavioural modelling are based on Training data alone. This is a change from the previous release when evaluation data was used in some parts and enables full support for insight measures and charts in standard modelling (see below).
Also added in this release:
-
Further options for selecting and displaying dimensions in charts
-
Where applicable, the concepts, charts and measures used for behavioural modelling are also available for standard modelling - see Standard Modelling Development Update - Q4 2022
-
Performance improvements with parallel building of dimensions - see Parallel Running of Dimensions
Let's take a closer look at these developments.
Niche Features: Positive and Negative
The idea of niche features was first introduced in the 2022 Q2 software release and refers to behavioural features which apply to only a few customers, but nonetheless provide a very strong positive indication of a good prospect. This has been extended to include negative niche features which, again, only apply to a few customers, but give a strong indication of a poor prospect.
For example, “Number of months since last web donation” might only apply to the niche 10% of supporters who have ever made a web donation but, for these people, it could highlight them as very unlikely to respond to a direct mail campaign (since they prefer online engagement).
We will consider a fuller definition for this in the "Insight Type” section below.
Insight Categories
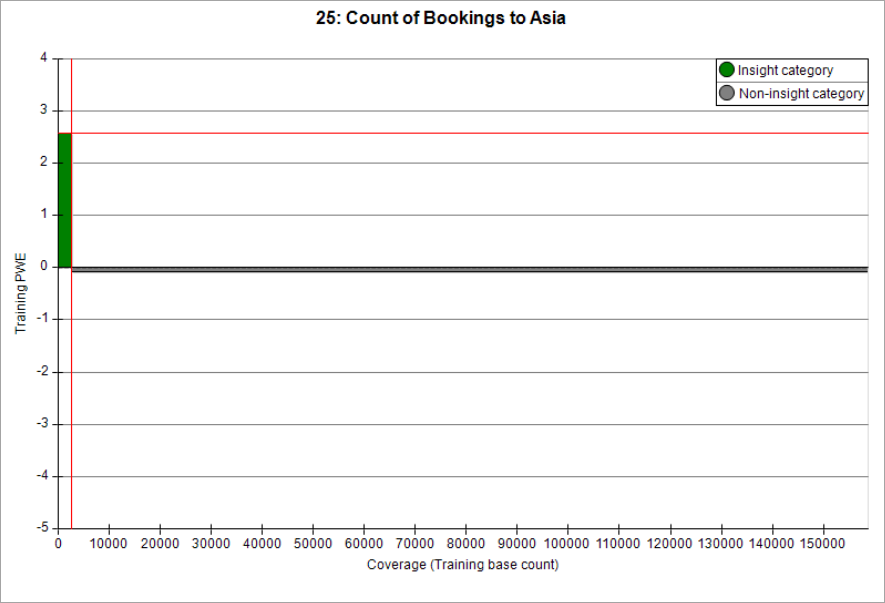
The insight categories of a dimension are those which enable a significant and sizeable prediction to be made about a person’s behaviour. A category is deemed “non-insight” if the Z-score is non-significant with an absolute value below 3.0, or the PWE score is too small with an absolute value below 0.1.
The chart above shows the PWE value from each category, where the width of the bar indicates the number of people in this category.
-
The bars are ordered from left to right according to PWE.
-
The category to the right of centre has a PWE value that is very close to 0 and would be classified as a non-insight category.
All categories of a dimension are now described as either “insight categories” or “non-insight categories”.
The vertical and horizontal cross hairs represent the Insight PWE and Insight Coverage measures which are described in the next sections.
Insight PWE
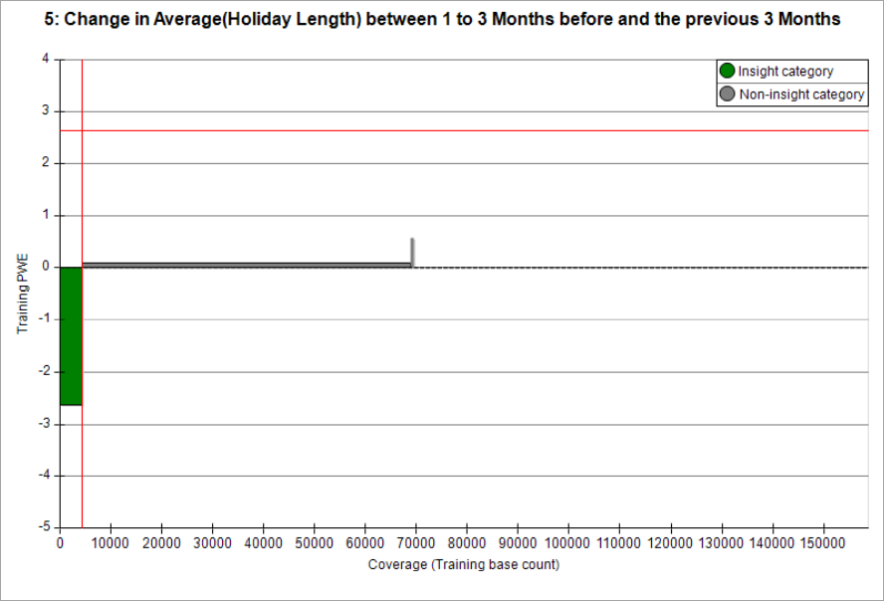
Insight PWE supersedes Uplift PWE (which only included positive PWE values) and provides a measure of the predictive strength of a dimension over those categories where a sizeable and significant prediction can be made (the ‘insight categories'). Insight PWE is the mean absolute PWE over just these categories, weighted by the number of people in each category.
The horizontal crosshair indicates the level of insight PWE for a feature. Here, where insight is predominantly positive or negative, this clearly fits to the size of the insight categories. This is less clear in the previous PWE v Coverage (Insight Categories) chart; this displays balanced insight since it is an average of both positive and negative values.
The traditional metric of “Mean PWE” takes into account all categories and, as a result, is dramatically reduced in the case of the niche features shown above; the mean would be reduced by the near-zero value that is scored by the majority of people. Consequently, niche features cannot be identified by just using their Mean PWE metric.
The concept “Insight PWE” supersedes the term “Uplift PWE” which only included positive PWE values. Insight PWE also includes sizeable negative values.
Insight Coverage
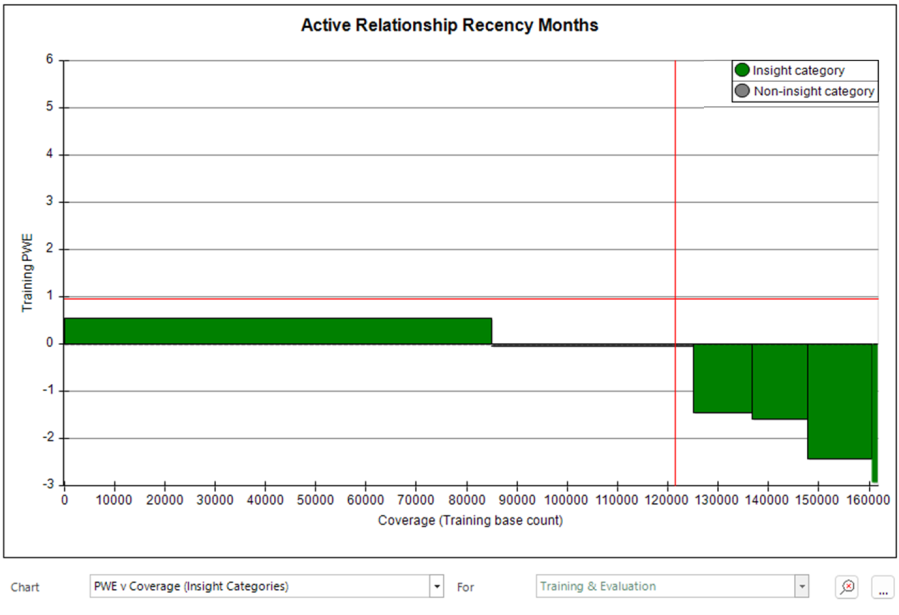
Insight coverage gives an indication of the number of people for whom the dimension is able to give a significant and sizeable prediction. It can be expressed as a simple count, or as a percentage of the total number of people in the Base selection.
The insight coverage can vary dramatically between dimensions when behavioural features are based on different transactional tables. For example, in the Holidays demo database, where only 40% of people have ever taken out insurance, any behavioural feature based on insurance data will never be able to make a prediction about the other 60% of people.
The vertical crosshair on the chart below shows the level of insight coverage. Since the feature is based on the date of someone’s last insurance policy, the majority of people are not scored by this feature. Hence the coverage is only about 10%
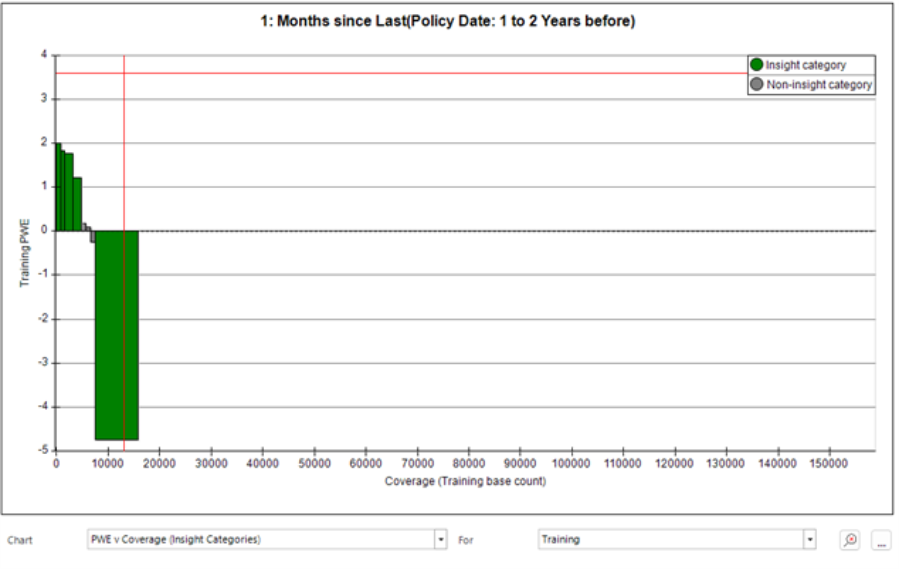
The feature above includes some non-insight categories with PWE values around zero. The width of these bars accounts for the offset in the position of the vertical crosshair, since they are not included in the Insight Coverage measure.
Insight Type
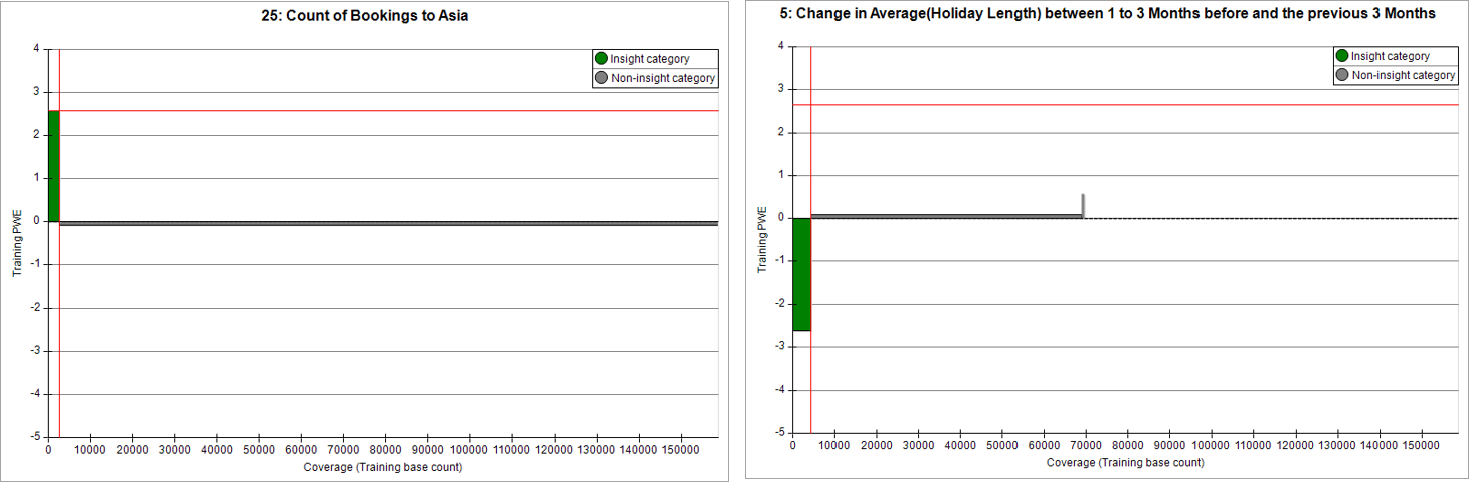
All features are now assigned an Insight Type based on the nature of the insight which they provide:
-
Positive features – where the insight categories predominantly have a positive PWE
-
Negative features – where the insight categories predominantly have a negaitive PWE
-
Balanced features – where the insight categories provide a balance of positive and negative insight
-
No insight – where there are no categories with a significant or sizeable PWE
The definitions use an 80:20 cut-off to categorise dimensions and, if the balance of positive/negative insight categories is less extreme than 80:20 based on coverage, the feature is classed as balanced.
A range of features from customer data is plotted below.
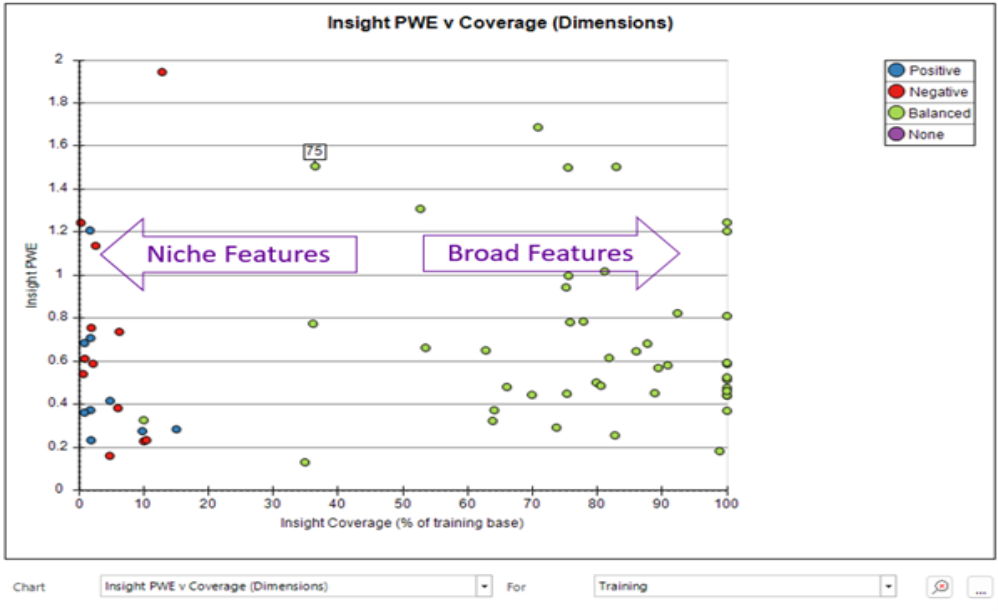
The terms “niche” and “broad" aren't given a formal definition or cut-off, but are based on a spectrum of insight coverage values, helpful to get a sense of how many people could be given a model score by each dimension.
Notice that the positive and negative features all have relatively low coverage and are generally niche features. This is not based on any formal definition, but is a consequence of the mathematics involved in calculating the PWE values. Where there is a category of a dimension which groups the majority of people together into a category such as “no previous transaction”, this category then dictates what the “average person looks like” and, so, people in this category have a very small PWE value (since the PWE value is a measure of the difference from average).
Insight columns
You can view the concepts and measures described above as columns within the Dimensions panel.
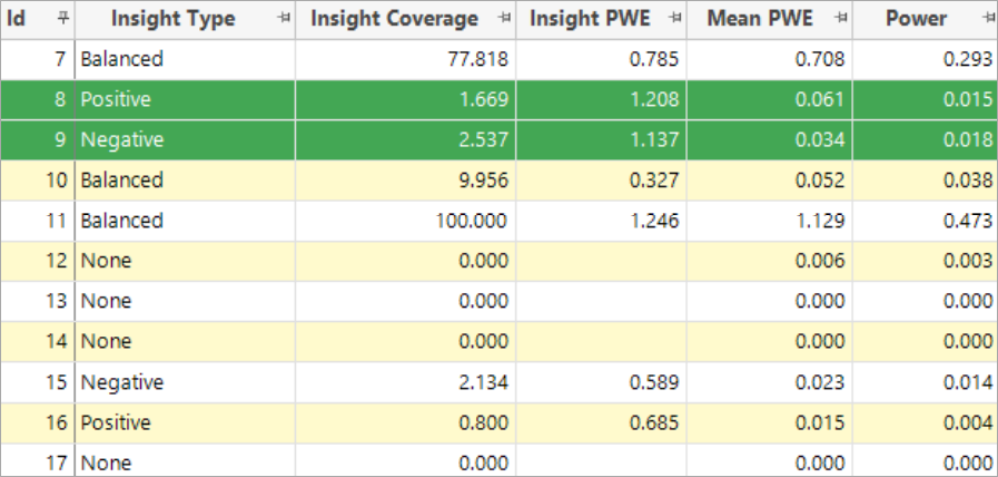
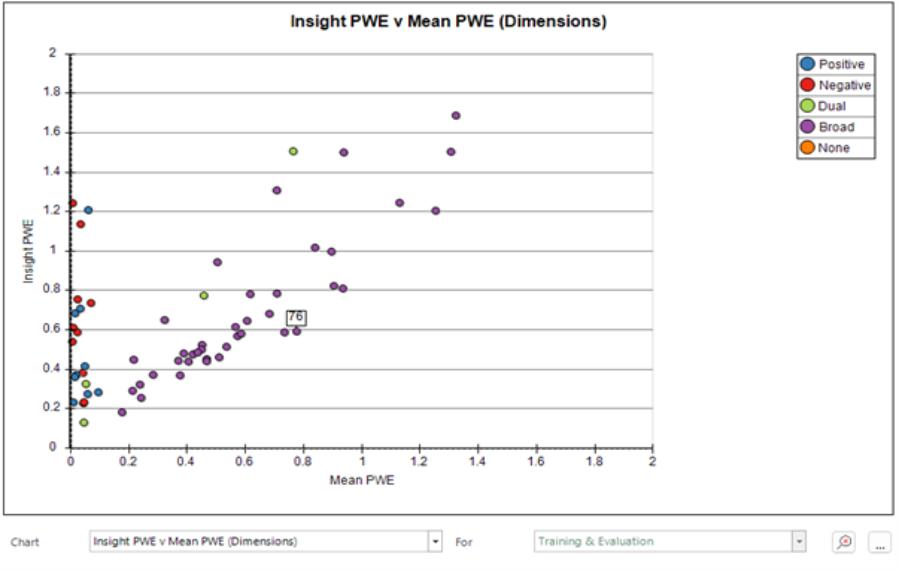
Notice the big difference between Insight PWE and Mean PWE for the highlighted positive and negative niche features. These have a very low insight coverage - they can only give insight on 1% or 2% of people, but for these people there is strong insight.
Also added in Q4 2022:
Further chart options
The chart options dialog (launched with the “…” button) offers more flexibility for the appearance of charts:
-
Option to hide as well as show dimensions
-
You can control dimension visibility in terms of tags, selected and used status
-
You have more options for how points are coloured, including Insight Type
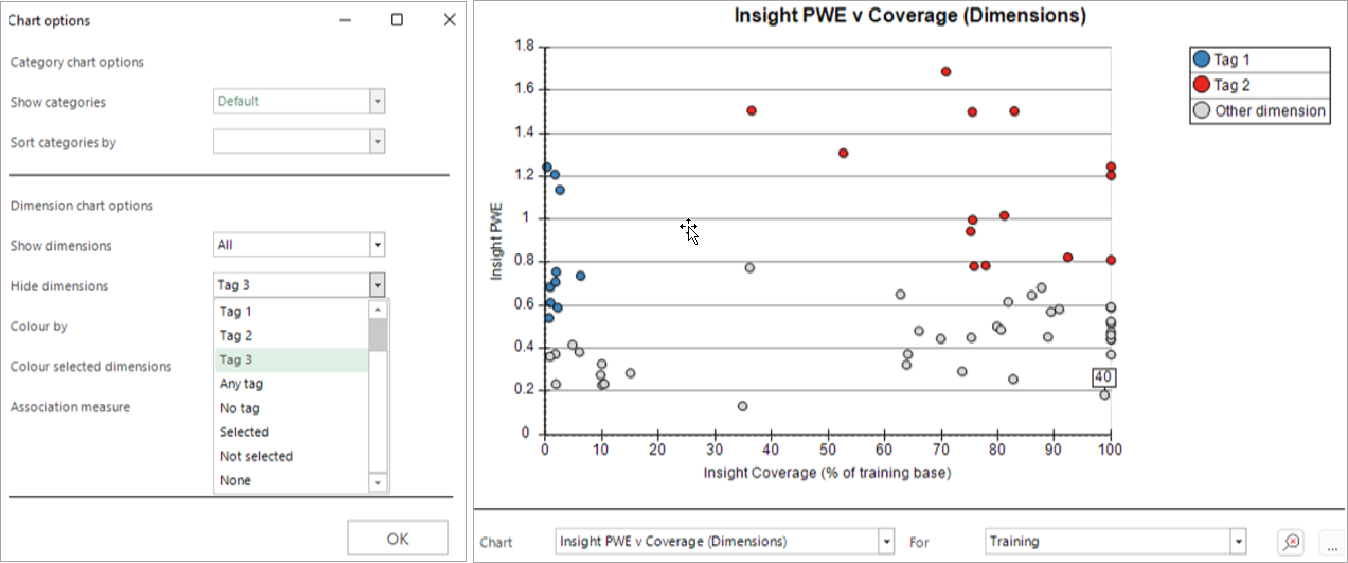
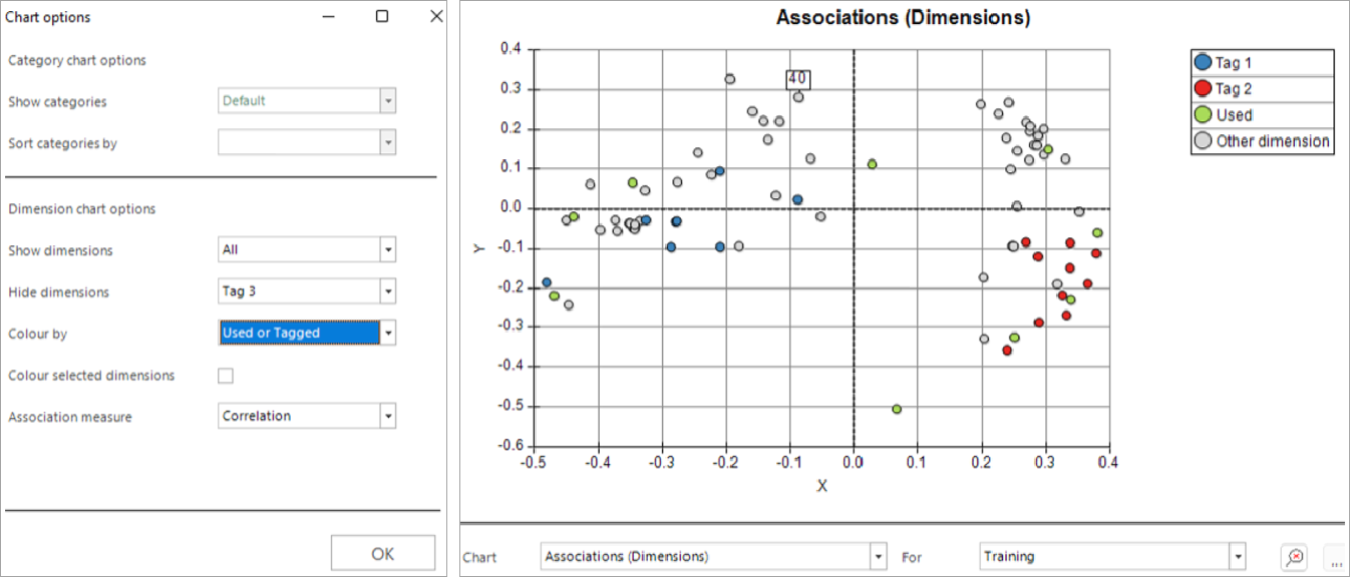
One useful work flow would be to use the above chart to select points (using a shift-click action to define a rectangle) and then tag the best niche and broad features (as above), before using the Associations chart to select a range of diverse features and mark these as used.
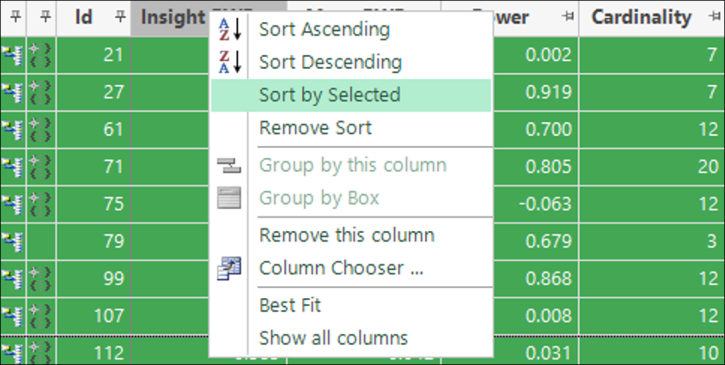
Sort list by selected columns
You can sort dimensions based on whether they are selected. This can be helpful for aligning the cells in the Association Matrix, which automatically follows the same sort order.
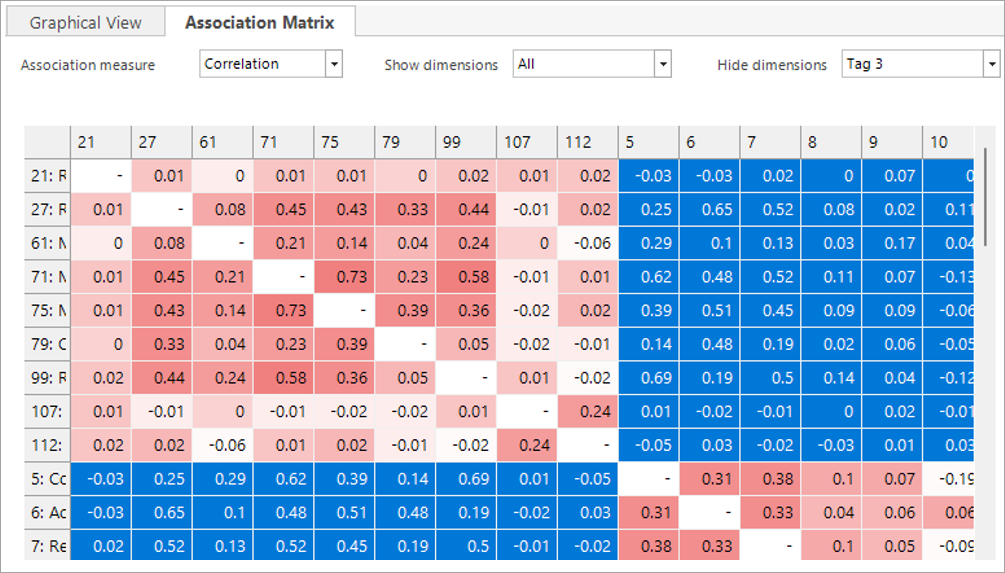
Association Matrix options
The Association Matrix supports the same show/hide controls as the dimension charts.
Choices are synchronised between the two places where the controls are displayed.
Insight definitions use Training data alone
The Insight definitions described in this document and used in Behavioural Modelling are now all based on training data alone, in order to support use in Standard Modelling where there is no concept of “Evaluation”. In the previous release, evaluation data was used in some parts.