Behavioural Modelling Development Update - Q1 2023
The selection of behavioural features has the greatest impact upon the final quality of a data model. Whilst recent development has introduced charts and metrics which help you to assess existing features in order to identify subsets which might be predictive or diverse, the main focus of the Q1 2023 development is to make it easier to generate alternative behavioural features (dimensions).
Updates include:
-
The ability to generate new behavioural features using one or more existing features as a template. Each new feature mirrors an existing feature, adding one additional criterion.
See Generating multiple Behavioural Features with different Criteria
See below for more information on the following developments:
-
More flexible control of building dimensions
-
Simpler user workflow with the "Use" status
-
The ability to thematically colour multi-dimension charts by Insight PWE
-
Updates to the right-click menu options
-
Edit Details option available in standard modelling
-
Chart and Build options are saved with the Modelling Environment
A further significant development is:
-
The ability to use a FastStats Cube to carry out additional and powerful analysis on the events within a complex customer journey selection
More flexible control of building dimensions
The Build control on the Dimensions tab gives greater flexibility and visibility of what is run.
It is possible to include or exclude specific types of dimensions, and then to specify which results to build. By default, results will not rebuild if they already exist for a dimension. However, this can be overridden.
For standard modelling, only Profile and Associations type results are offered.
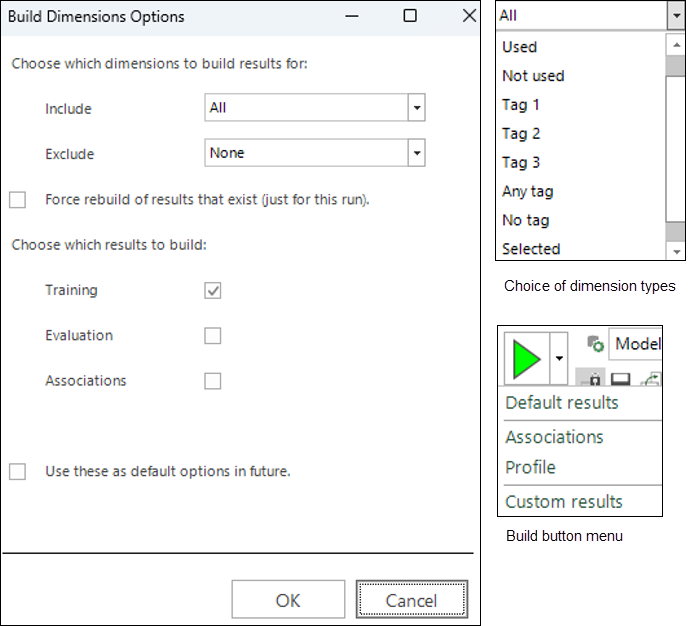
This set of choices is presented each time the Build button is clicked, until you check the "Use these as..." box at the bottom of the dialog. For example, you could set up your preferred way of building so that it only includes selected dimensions, and then choose to always build both training and evaluation profiles. The options you select are saved with the Modelling Environment.
Once you have checked the box to use the given options as the default, you can relaunch the Custom Results dialog using the sub option on the Build button menu (shown above).
Clicking OK will present a confirmation dialog of what needs to be run:
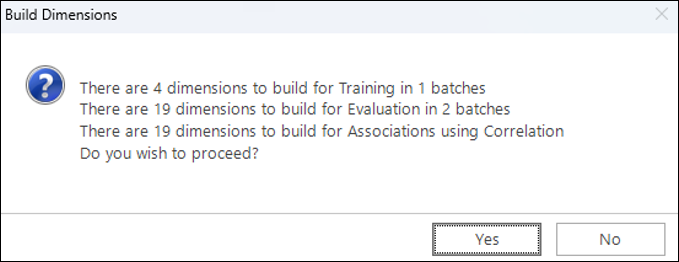
Click OK here to start the build.
As results are returned, an icon against each dimension indicates which profile results are available. There is no icon for Association results - instead view the Association Matrix to see which results have been calculated.

Once the build has started, clicking the  cancel button will stop the whole build package:

Simpler user workflow with the “Use” status
Your workflow is now simpler in terms of how the “Use” status flag operates.
In previous releases, dimensions were only built when the “Use” flag was checked, but this is no longer the case. As explained under the More flexible control of building dimensions section above, you can choose which dimensions to build in several ways. Now the purpose of the “Use” flag is only to determine which dimensions to take forward when launching a model.
The workflow is:
-
Create some initial dimensions - which are added to the list without the “Use” flag being ticked.
-
Modify these, or generate alternative dimensions – again added without the “Use” flag.
-
Assess dimensions using charts and metrics – mark subsets of dimensions with “Tags”.
-
Choose a subset of predictive and diverse dimensions - mark these with the “Use” flag.
-
Launch a Profile or Decision Tree which will take the dimensions marked as “Use”.
This serves to simplify the choices that you need to make, as dimensions are created using the behavioural modelling menus.
For example, in the case where you select one dimension and generate five features - let's say, one for each continent; if one of the generated features already existed in the list, the following dialog would be displayed:
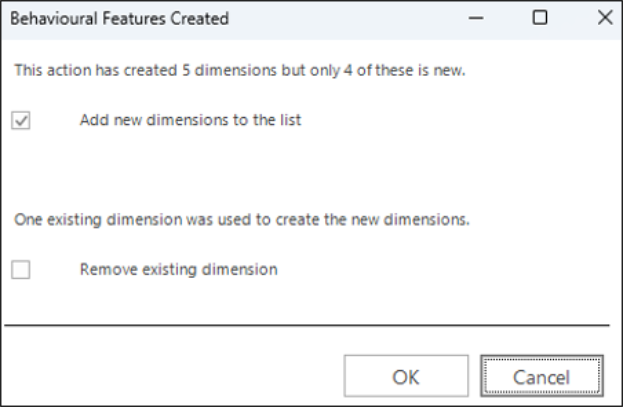
You have the choice to:
-
Proceed and add the four new dimensions
-
Remove the selected dimension
-
Cancel and do neither
Colour by Insight PWE
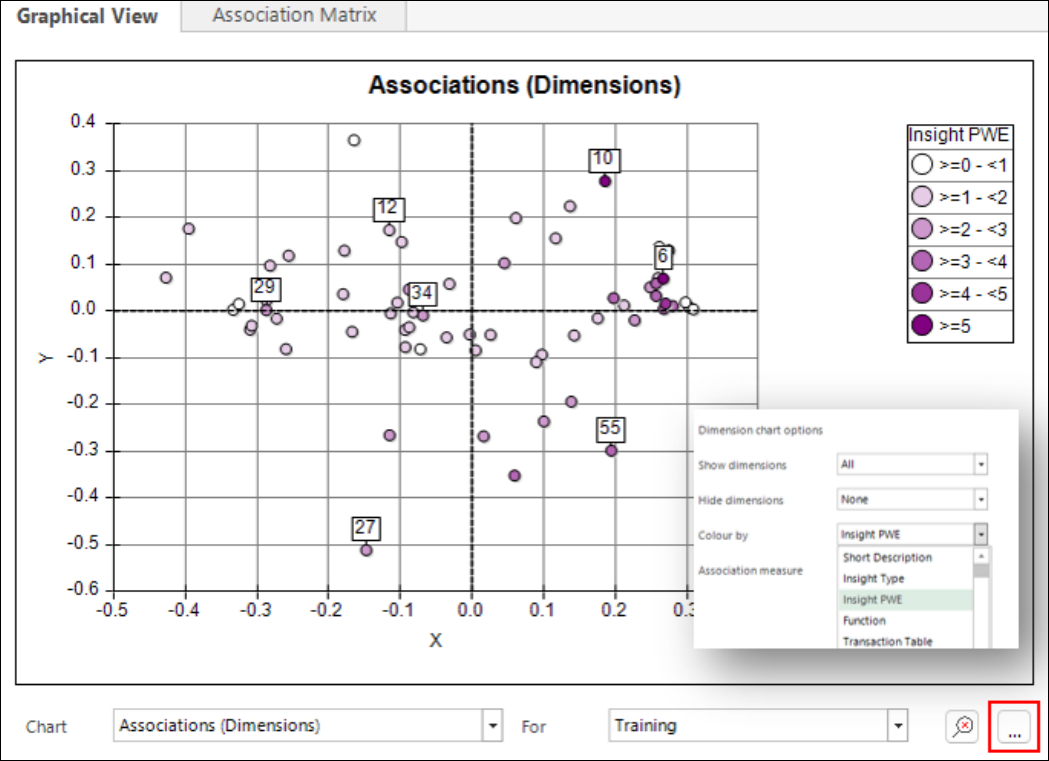
Charts which show multiple dimensions can now be coloured thematically based on the Insight PWE value. By using the Associations chart and selecting a range of dark points which are spread out, it is possible to choose a subset of both predictive and diverse features in one go.
Right-click menu options
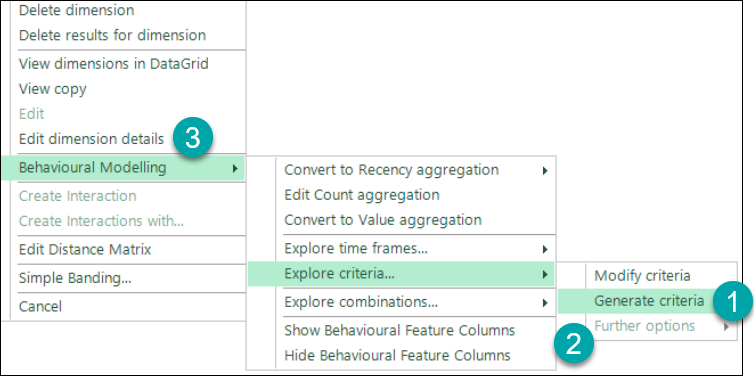
There have been some small changes to the right-click menu which is available when clicking on a dimension, as shown below:
-
The Generate criteria option now sits outside of the Further options section.
-
You can only access Further options when clicking on a dimension with existing criteria. It allows you to generate a relative to total feature, or to combine the criteria from multiple dimensions.
-
The Edit dimension details option is now also available in standard modelling, and for simple variable dimensions; previously, it was on the Behavioural Modelling sub-menu. See Standard Modelling Development Update - Q1 2023 for more information.
Saving chart and build options
Any options you select for configuring a chart display are now saved with Modelling Environment. As mentioned above, this is also the case for your chosen build options.