Incremental Insight
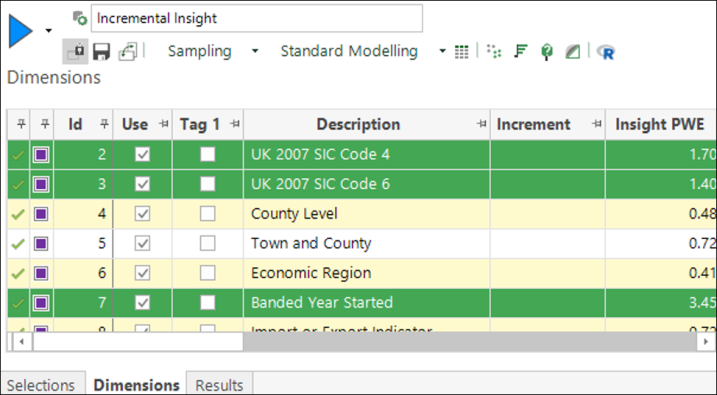
Incremental Insight provides a single measure that allows you to choose dimensions which are both predictive and diverse. It is based on the Insight PWE metric, but accounts for the associations between dimensions. When building the dimension results, there is an additional option which allows for incremental insight to be calculated.
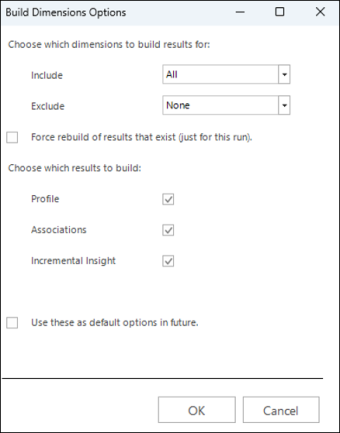
As the calculation relies on the profile and association results, these must either be built at the same time, or have been built previously.
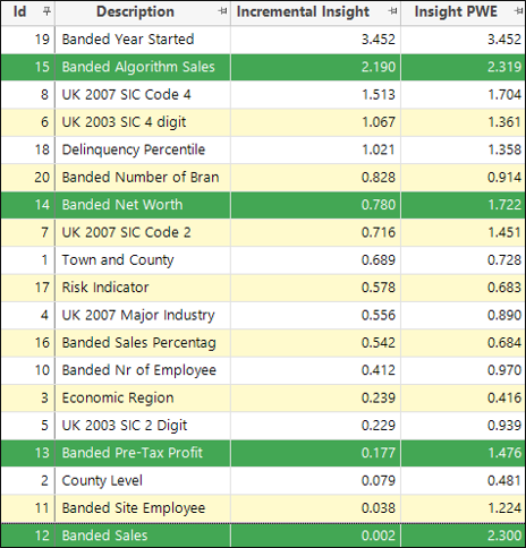
In the example below, the dimensions are sorted by Insight PWE. Notice that two of the top three dimensions are sales-based variables and, consequently, correlated.
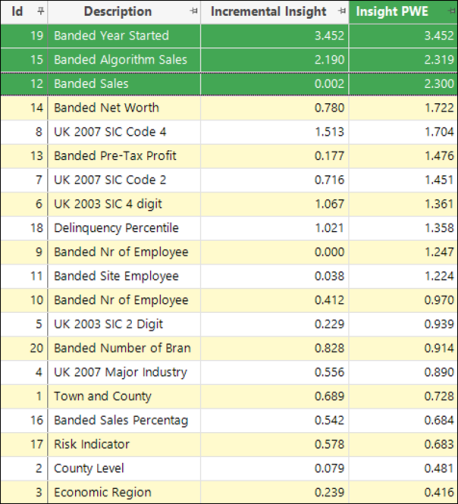
When sorted by Incremental Insight (see Approach for calculating Incremental Insight for how this is calculated), the top two dimensions - since they are broadly unrelated - remain the same. However, because it is significantly correlated with "Banded Algorithm Sales", the “Banded Sales” variable provides very little additional insight and, as such, is pushed down in the ranking.
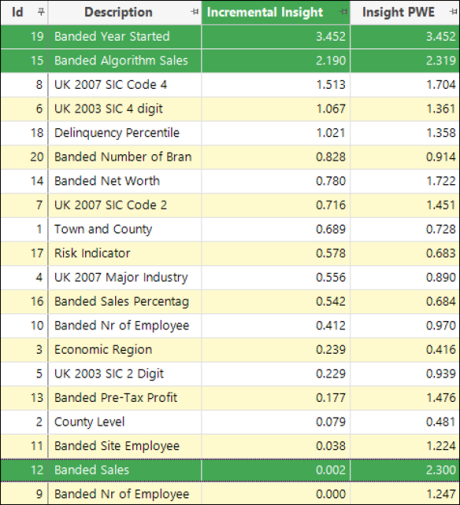
When you select the top dimensions based on Incremental Insight - as shown below - it results in the use of a broader range of variables which would not otherwise be chosen:
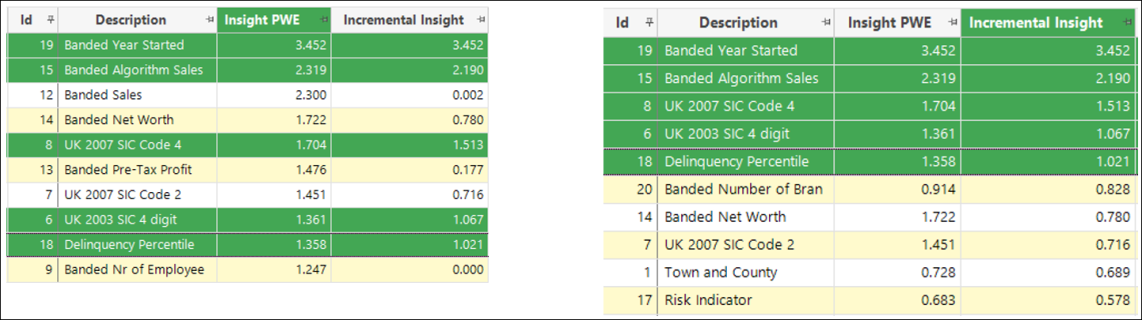
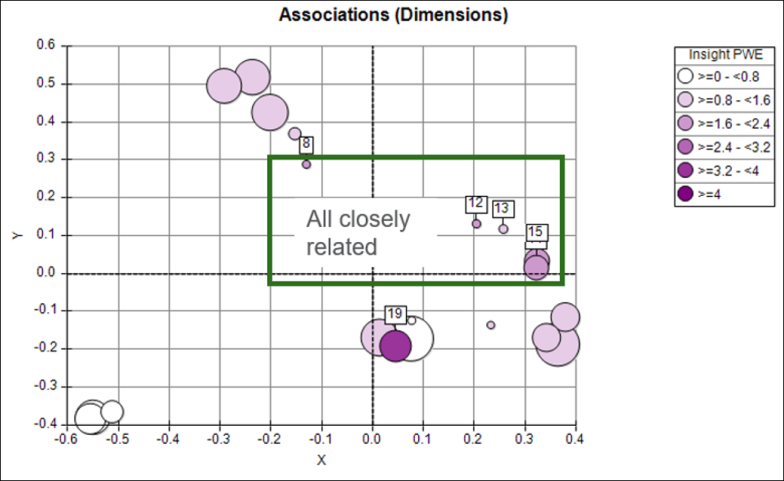
Shown graphically, the chart below displays the top dimensions based on Insight PWE and you can see that these are relatively close together in the Associations chart:
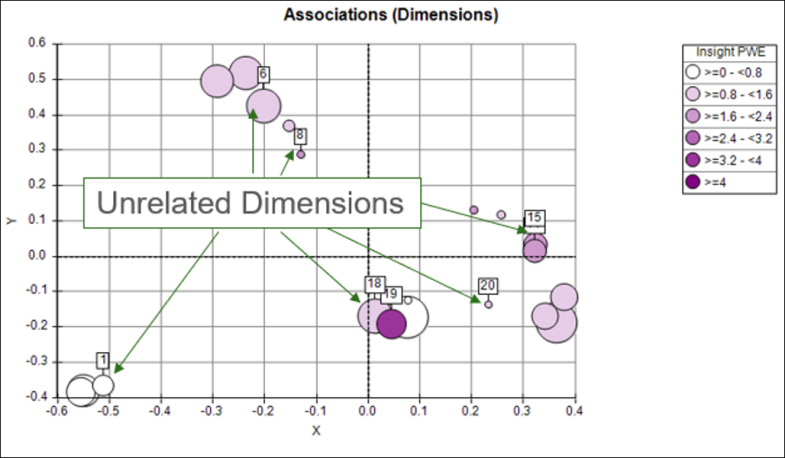
The next chart shows the top dimensions chosen by Incremental Insight and, although these are individually lower in Insight PWE, collectively they provide more diverse insight and, hence, produce a model which captures more aspects of a good prospect:
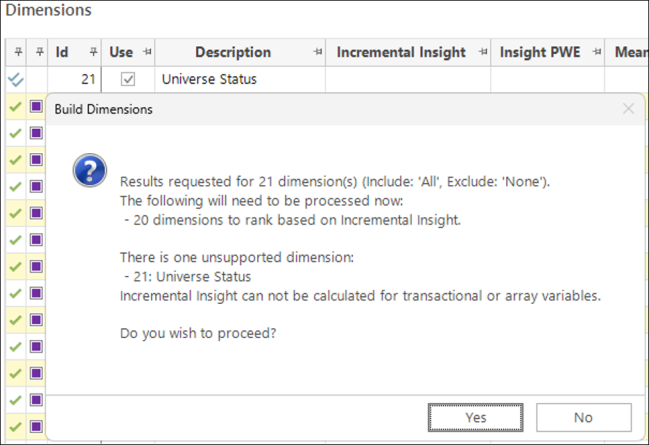
You cannot currently calculate Incremental Insight for transactional or flag array variables. Since they hold multiple values for each individual record, correlations using these variables are not calculated by FastStats.
You will see a warning if you try to calculate Incremental Insight for transactional or flag array variables:
Show most Correlated Dimensions
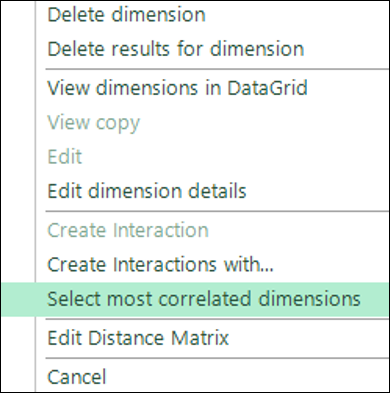
There is a right-click option to Select most correlated dimensions:
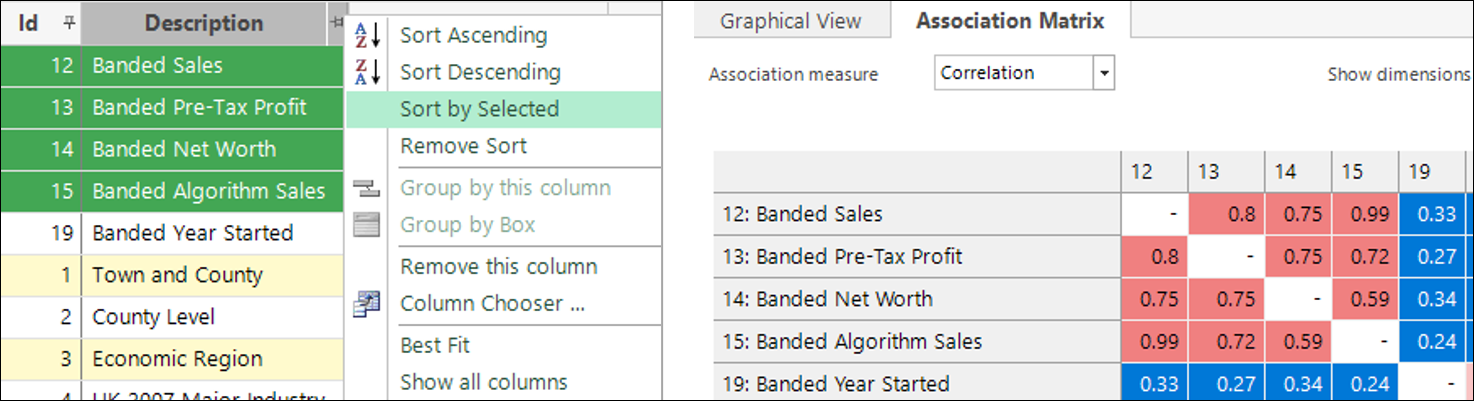
In this example, when applied to “Banded Sales”, it highlights which other dimensions higher up in the ranking are most correlated and, therefore, causing this variable to have lower incremental insight:
The right-click option to Sort by Selected brings these dimensions to the top so that the Association grid can clearly display how correlated they are:
Show dimensions used in a model
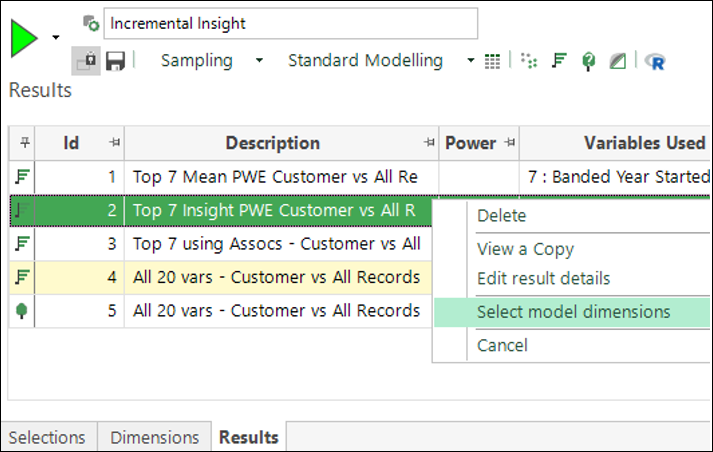
By providing the choice of dimensions which are both predictive and diverse, Incremental Insight facilitates a better overall model. You can create alternative models within the FastStats Modelling Environment using existing functionality - these are listed on the Results tab. To compare the models and understand the differences, you can right click on a previously built model and choose the option to Select model dimensions:
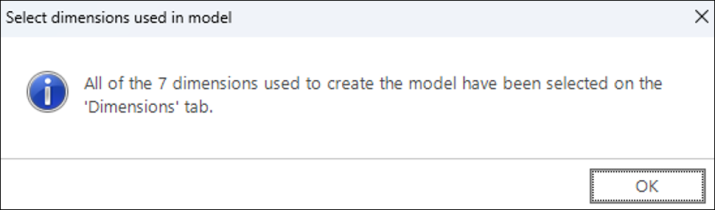
The dimensions used to create the model are then selected in the dimensions tab:
Change back to the dimensions tab to see which dimensions were used when the model was created:
Approach for calculating Incremental Insight
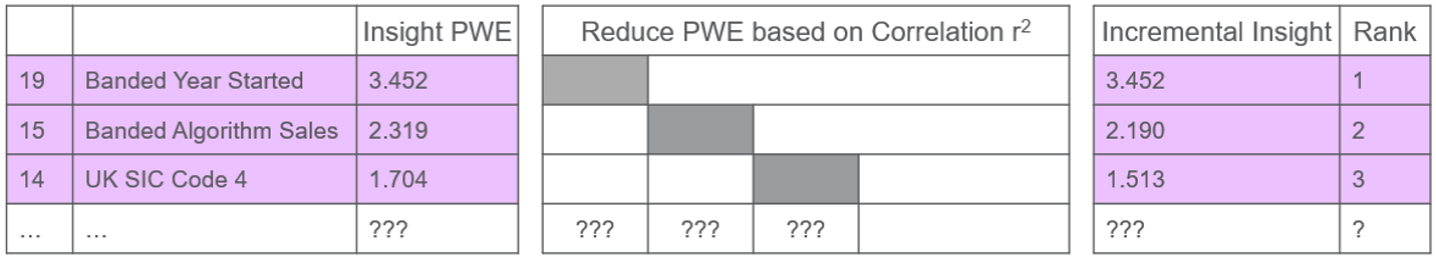
The values of Incremental Insight are calculated iteratively for a set of dimensions - demonstrated by the steps below.
Notice that the values for a particular dimension change depending on which other dimensions are already chosen. Once calculated, if dimensions are then added or removed, the values need to be recalculated.
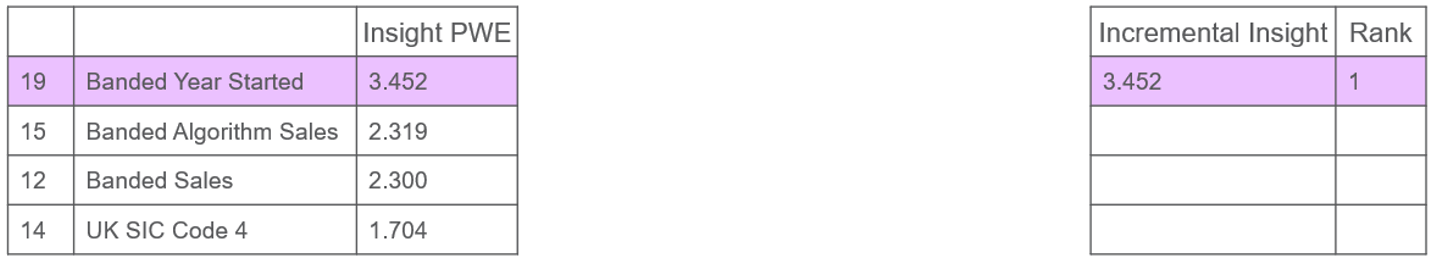
Step 1:
The dimensions are sorted based on Insight PWE. The top dimension is assigned rank 1 and the Incremental Insight value is equal to this dimension’s Insight PWE.
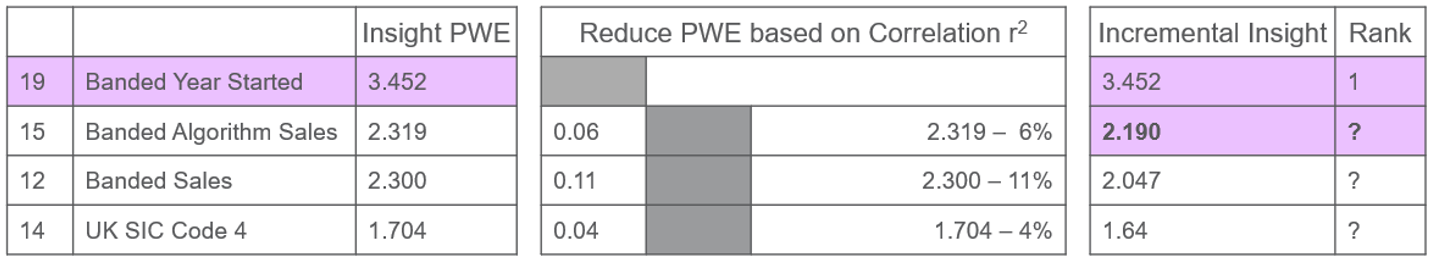
Step 2:
Each other dimension is then considered, and its Insight PWE value reduced, based on its correlation with the already selected dimension (using the r-squared value) to give the Incremental Insight value. The dimension with the highest value is assigned rank 2. In the example below, this is the same dimension that would be chosen based purely on Insight PWE.
Step 3:
The process is repeated, again considering each other dimension, and reducing its Insight PWE based on the correlations with both of the already selected dimensions. In the example below, this pushes the Banded Sales variable right down in the ranking because it is so correlated with the Banded Algorithm Sales.
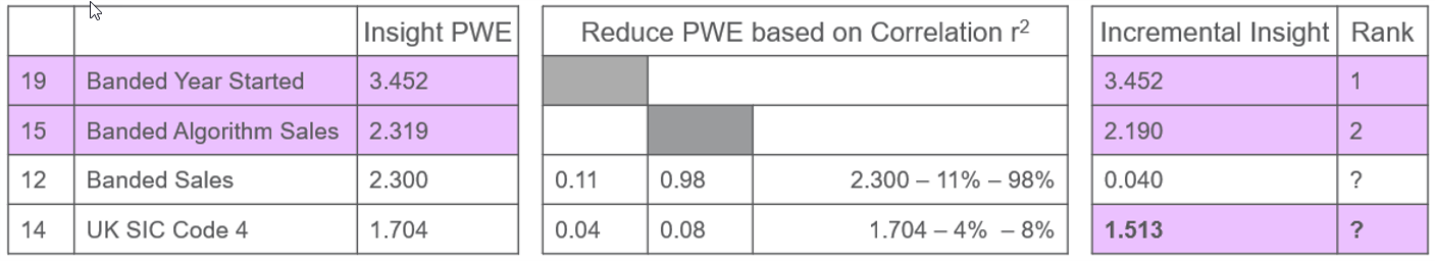
Repeat Step 3:
The process is repeated iteratively, each time reducing the Insight PWE based on the correlation with all the dimensions that are already chosen.
The correlation values typically quoted, and shown in the associations grid, are values of the correlation coefficient “r”. This value squared gives “r-squared” (r2) and measures the proportion of the variance of one variable, explained by the other variable (calculated as r times r). The Insight PWE is reduced by this proportion.