Behavioural modelling - creating recency dimensions using selector variables
Added in Q1 25
Whilst most typically you may create recency dimensions using numeric variables (e.g. count of purchases in the last year...most recent donation value), you can also use selector variables (e.g. product of last purchase). Since the category associated with a person's recent behaviour is often very predictive, these types of behavioural features can result in more powerful models and, in turn, facilitate more targeted campaigning.
Let's consider the following example:
Does the destination someone last visited have any bearing on them buying a travel insurance policy?
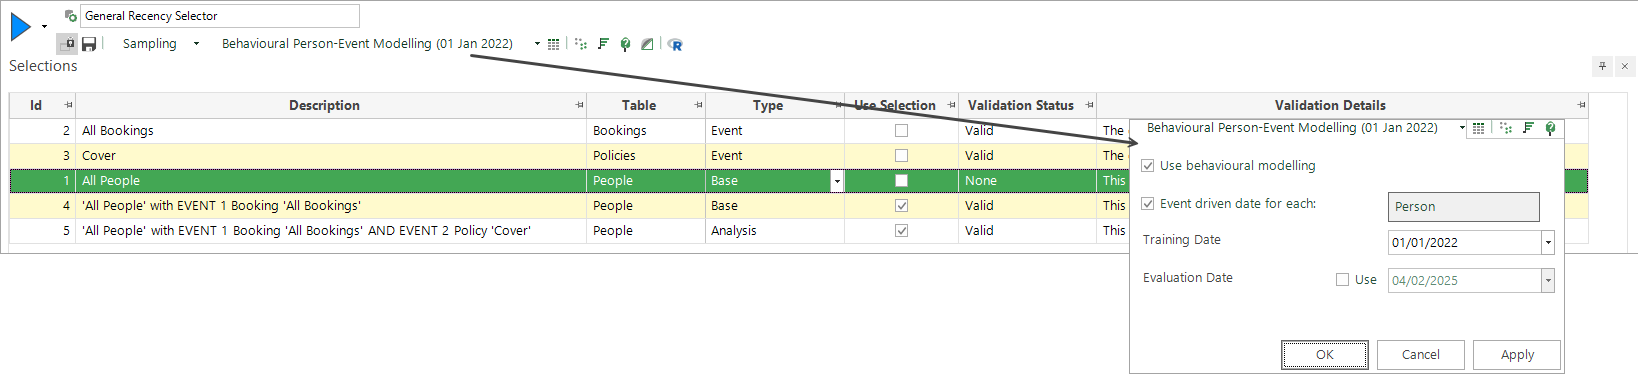
In this example, the model is trained to identify people who make a booking and then take out insurance. Identifying what is different about these people allows you to create and promote more targeted travel insurance campaigns.
Here the behavioural feature needs to:
-
Group bookings up to the person level.
-
Order each person's records by booking date.
-
Identify a person's last booking.
-
Identify and examine destinations visited.
To get started:
-
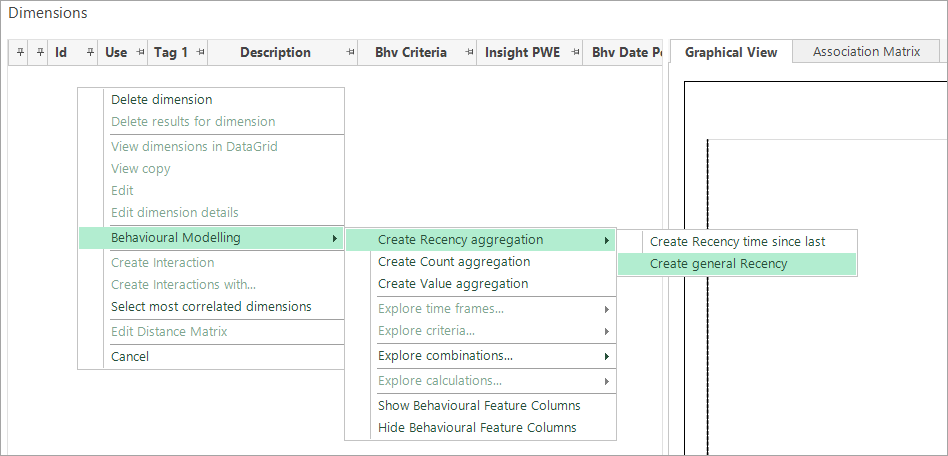
Right click within the Dimensions panel, hover over Behavioural Modelling and select Create Recency aggregation.
-
Select Create general Recency.
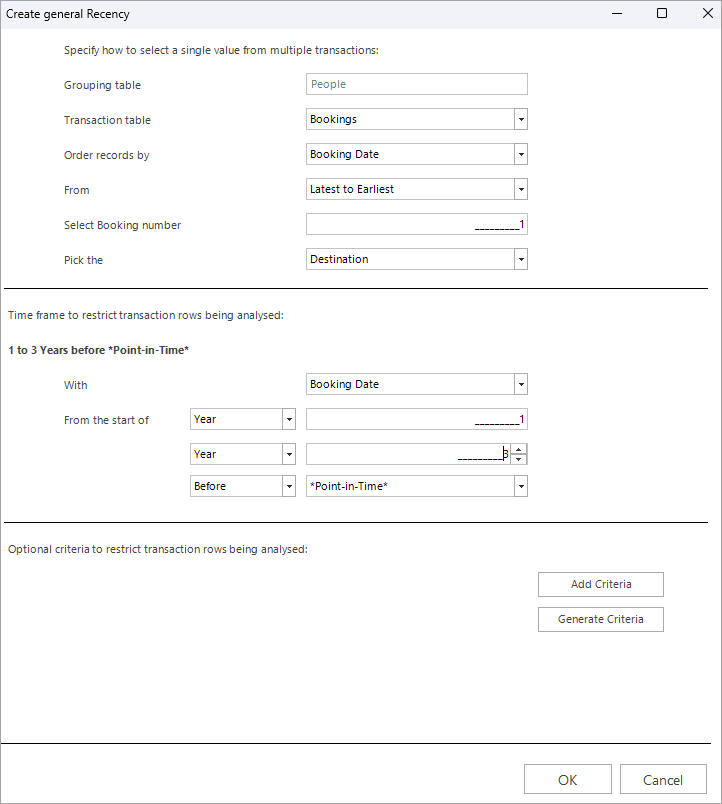
The resulting window comprises of 3 sections:
-
The top panel is where you identify the transactional table the count should take place on, as well as which table to aggregate the transactions up to.
-
The middle panel is where you set the timeframe within which the transactions should have occurred. This can be significant - for example, a 'last policy' may have been taken very recently, or long ago. If a transaction occurred 10 years ago, is it still relevant and worth including?
-
The bottom panel allows you to add further criteria, but is not relevant in this example.
-
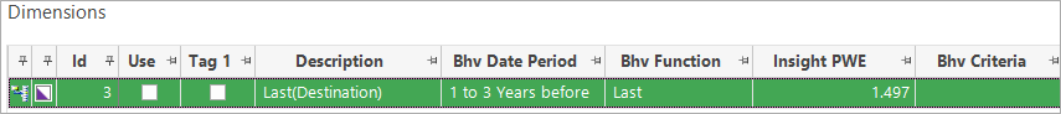
Complete the settings as per the screenshot below:
-
Click OK - a confirmation is displayed:
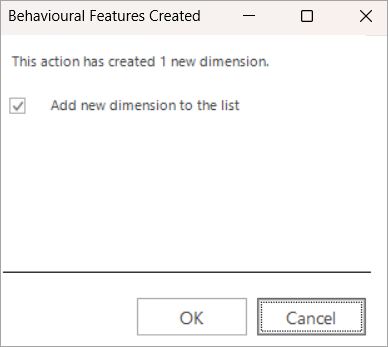
-
Click OK to add the dimension:
You can now build the dimension and generate a graphical display.
Use the action menu [...] in the bottom right corner of the graphical view to access the chart options and edit the default chart display. For example, the display below shows the top 20 categories sorted by PWE.
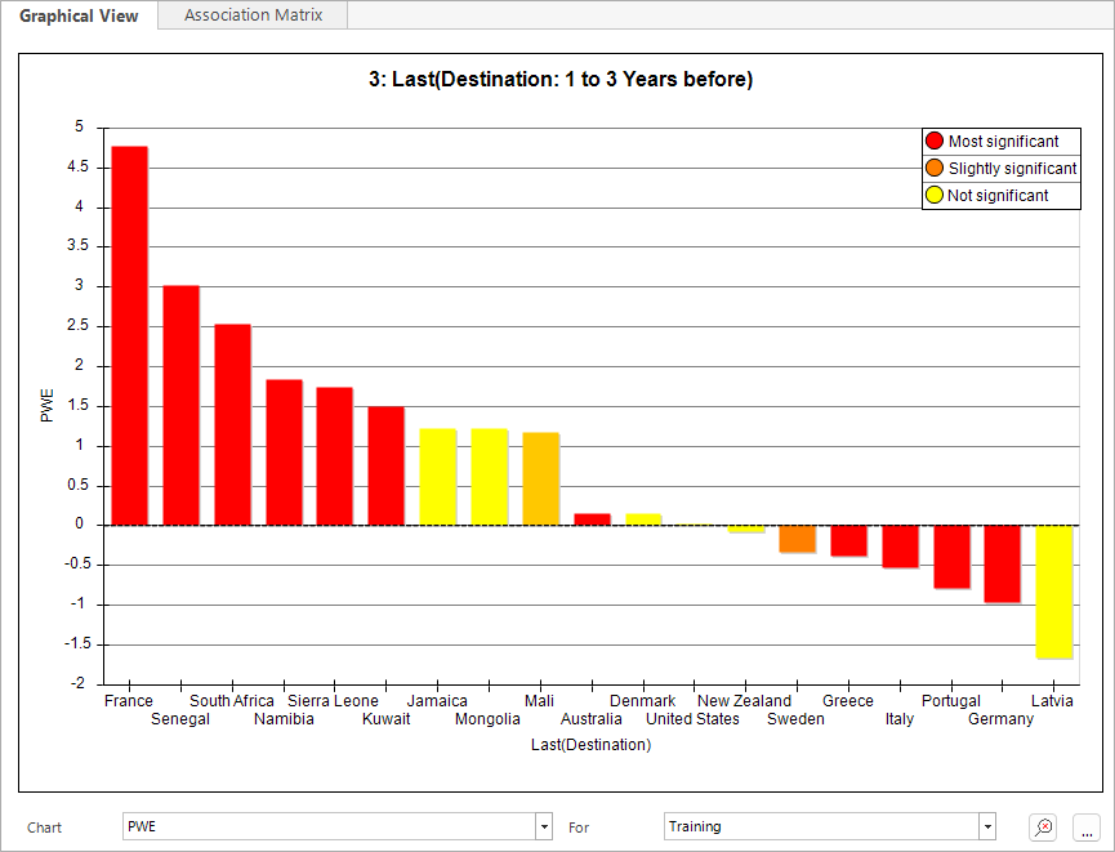
The PWE chart above shows that the destination of a person's last booking is predictive of whether they then take insurance. A little more investigation might reveal that those holidays to France are predominantly skiing trips in the Alps, whilst safaris could be a key activity during those holidays to more adventurous locations. Generally, people appear less likely to go on and purchase insurance when they are travelling to European countries.
For a further example of creating a recency dimension, see Behavioural modelling - recency dimensions (behavioural features)
For related topics see Behavioural modelling - creating dimensions (behavioural features)