Behavioural modelling - templates
Added in Q3 2025
Preparatory work has begun for behavioural modelling templates to become available and usable in Apteco Orbit. In the interim, confident users with a sound working knowledge of FastStats' behavioural modelling can access and benefit from this work through the FastStats Modelling Environment. Please note that the functionality and user interface in this first release are subject to ongoing development which will be made available in future software releases.
The Q3 2025 software release includes the first iteration of a new mechanism which allows you to create behavioural models on one system and then template and share them to other systems that share a similar data structure. For example, if you have created a churn model that delivers significant improvements for targeting customers likely to churn, you could roll this out and then tailor and extend it further for other systems. Not only do templates save time, they also allow the expertise of the person building the original model to be shared with others.
The first iteration has been designed specifically to enable a standard set of models to be created for non-personally identifiable information (Non P.I.I.) charity systems. Non P.I.I. systems are all based on a simple data structure involving only the person table and one transaction table, and 2 variables - transaction date and transaction value. Templates are restricted to this data structure, with the addition of an extra transaction type and transaction category which enables features such as "Donation Type = Legacy".
The following example introduces the key stages involved in creating, exporting and importing a behavioural modelling template and includes:
Example churn model
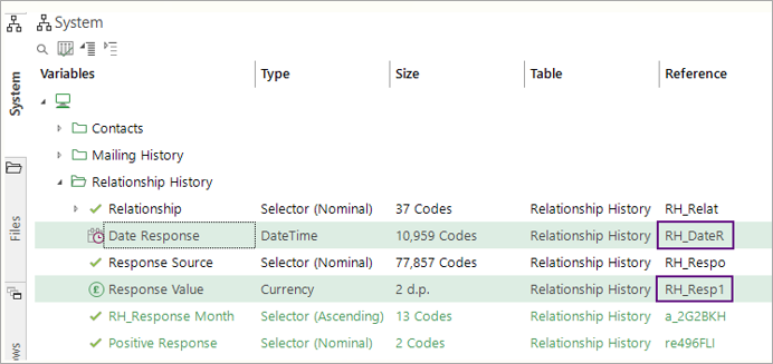
The following behavioural features have been developed on a demonstration charity system using Donation Date and Donation Amount variables.
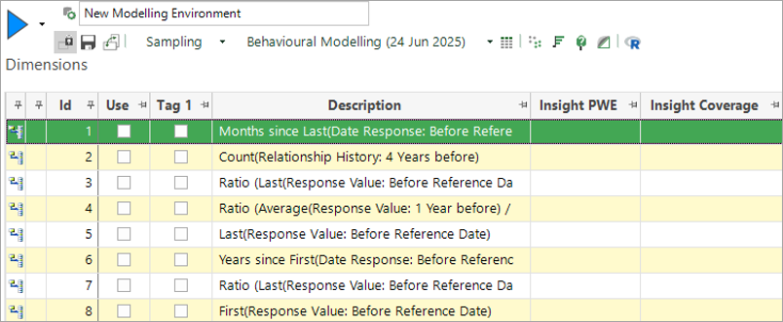
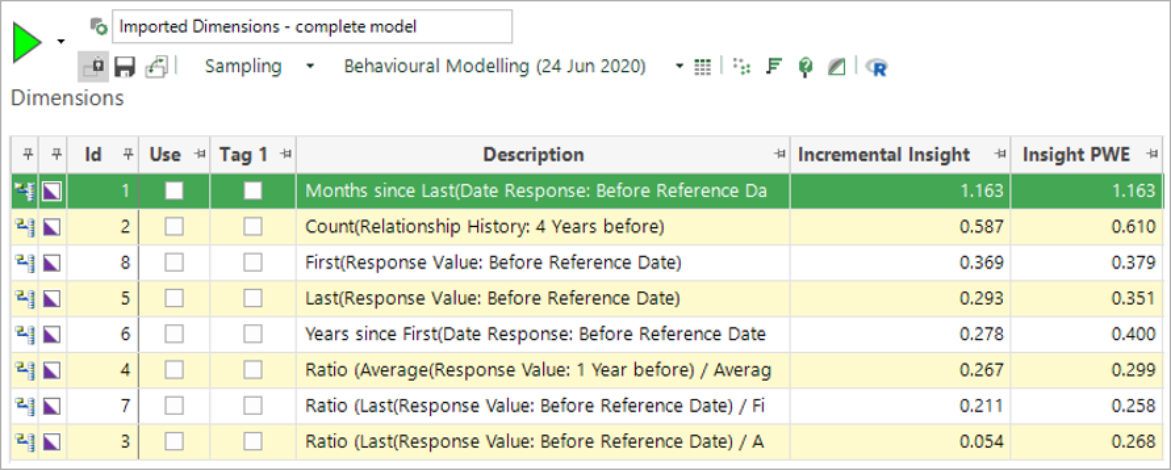
A model has been developed to predict the likelihood of supporters to churn (see the definition for this in more detail below). After several iterations, the variables to be used in the model have been refined, and the most predictive variables have been ranked based upon Incremental insight. These variables and their associated ranking can be seen in the following table.
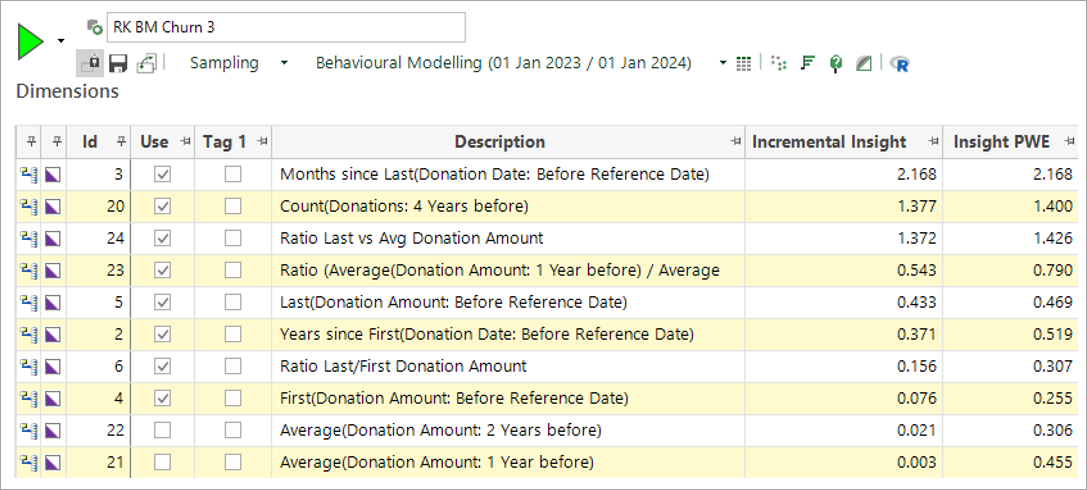
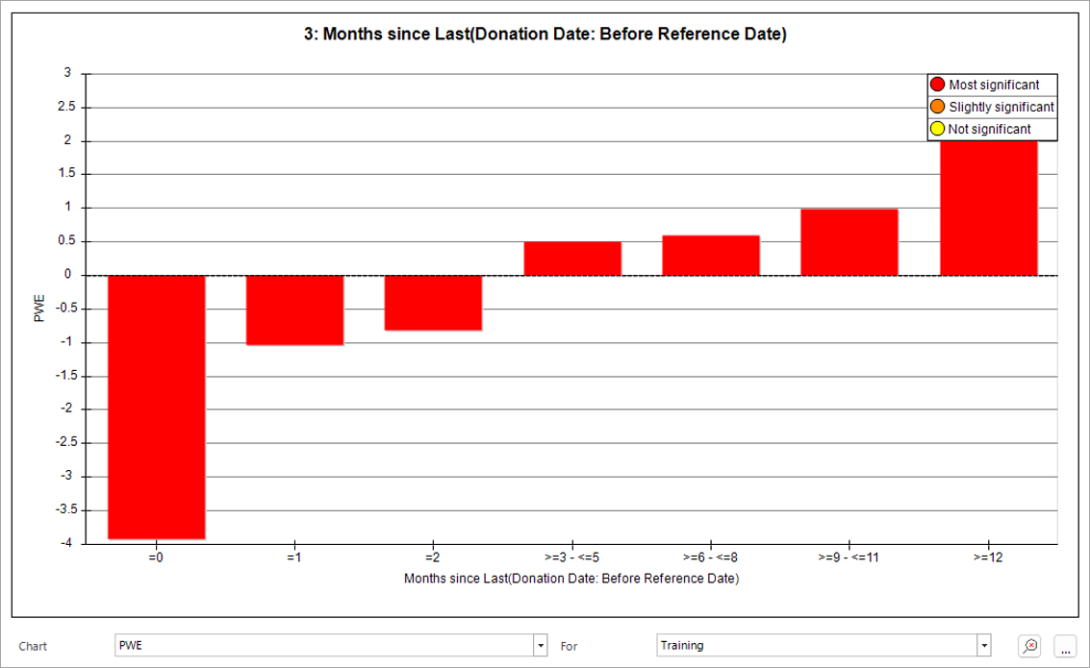
For example, this model shows that people with a recent donation are less likely to churn. While this is not particularly surprising, it is still very useful that you can target or avoid supporters based on this information.
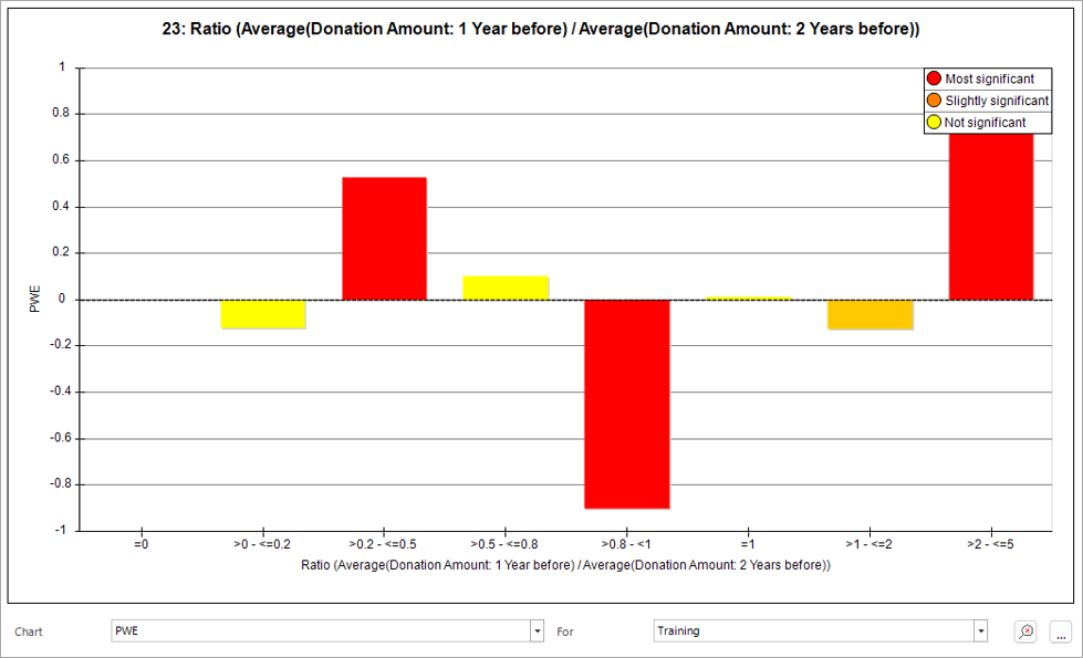
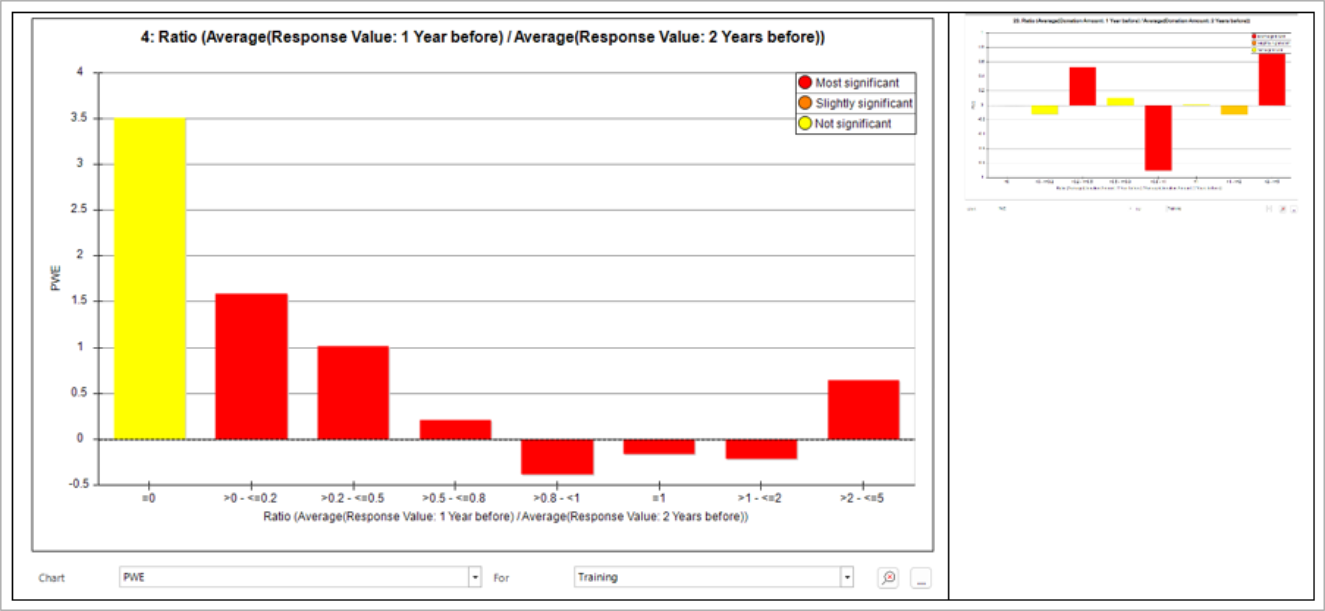
Some of the more involved features provide greater and potentially unexpected insight. The following chart shows that people who made a modest reduction in their average donation are less likely to churn. This is based on the last year’s average donation being 80 to 100% that of the previous year. People who have made a much larger reduction (20-50%) are likely to churn. Interestingly, people who have made a large increase in their donation value are also likely to churn.
Exporting dimensions
Selected dimensions can be exported as a template to the clipboard using the right click menu options, as shown below.
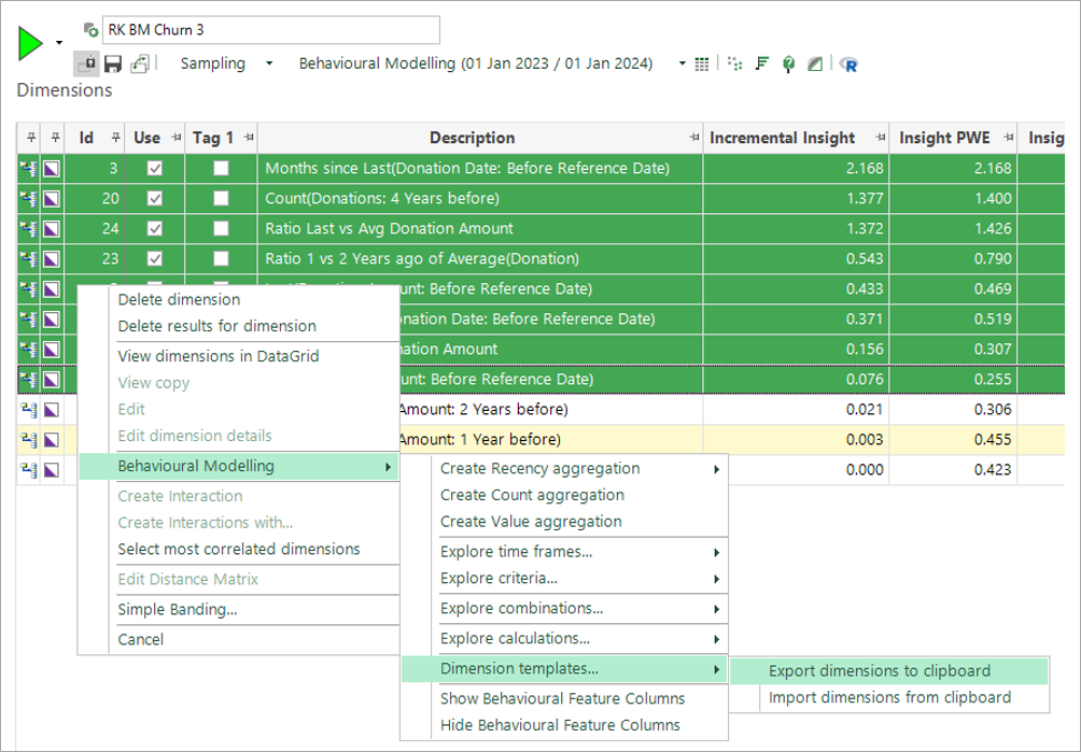
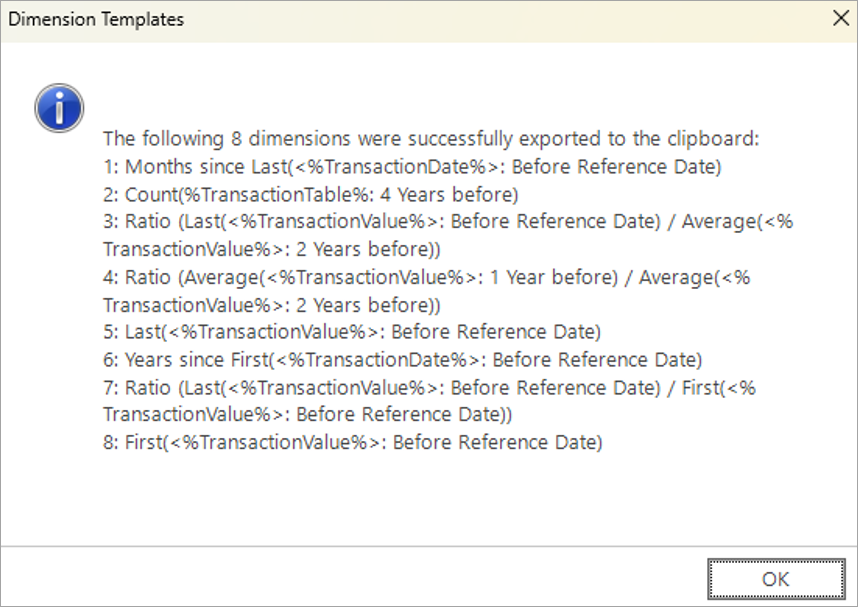
The confirmation message shows that the dimensions have been exported. Notice that the behavioural features are now expressed in terms of placeholders, such as <%TransactionDate%>.
Modifying the template for another system
In this first release, the template must be edited by pasting into an editor such as Notepad++.
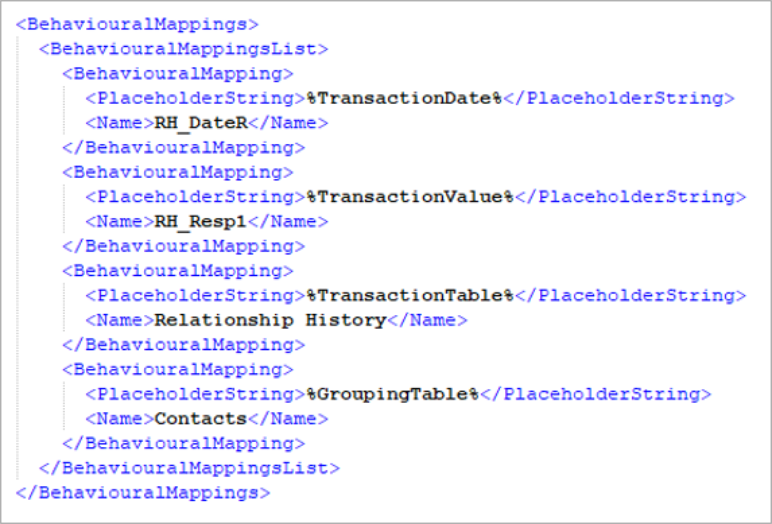
The top section of the template shows the mappings between the placeholder and the variable, or table name of the system, in which the template was created. These names must be manually changed in the editor to match the variables and tables on the system into which you wish to import the template.
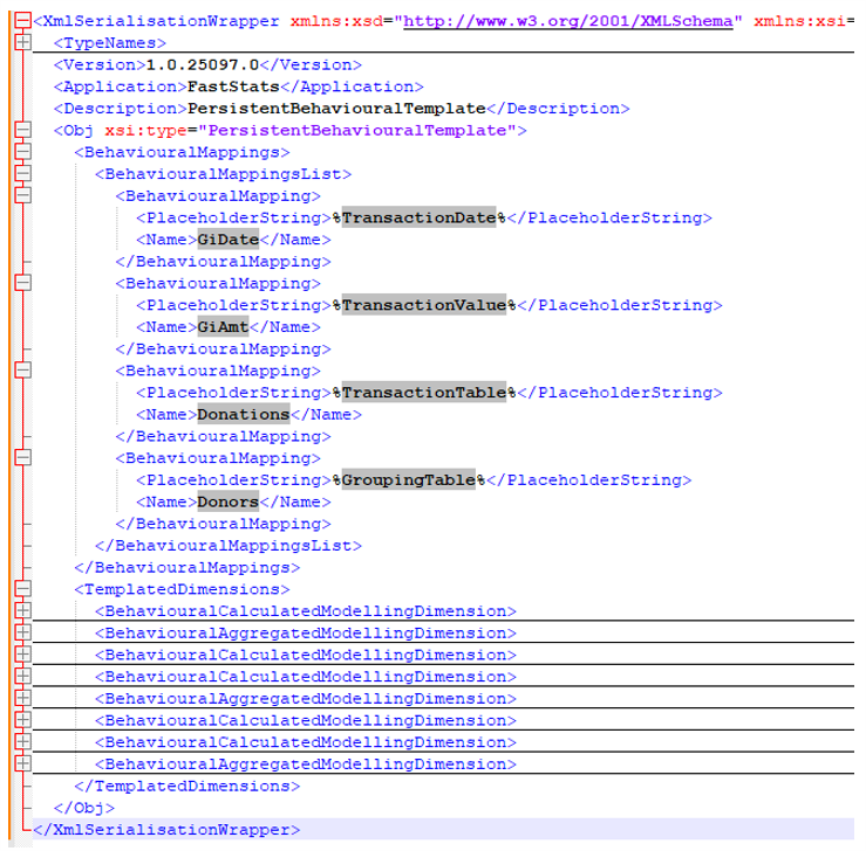
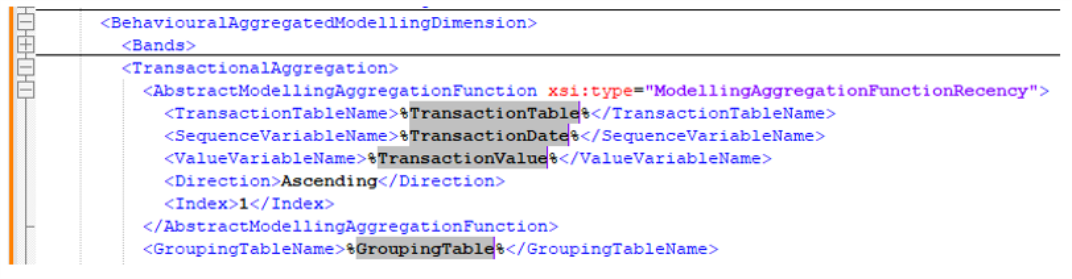
The bottom section of the template should not be edited. It gives the definitions of the behavioural features in terms of the placeholders, instead of specific variable and table names. For example:
Importing the template into another system
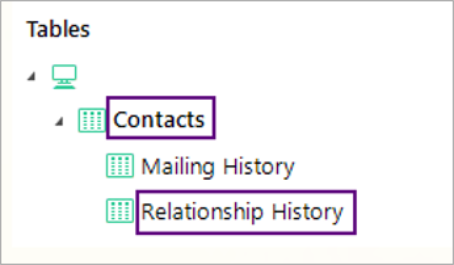
Log into the second system and, as the tables and variables used to conduct the initial behavioural modelling, identify the names of the person and transaction tables, and of the transaction date and value variables.
You should edit the template to reflect the variable and table names of the new system, then select the whole document and copy it to the clipboard.
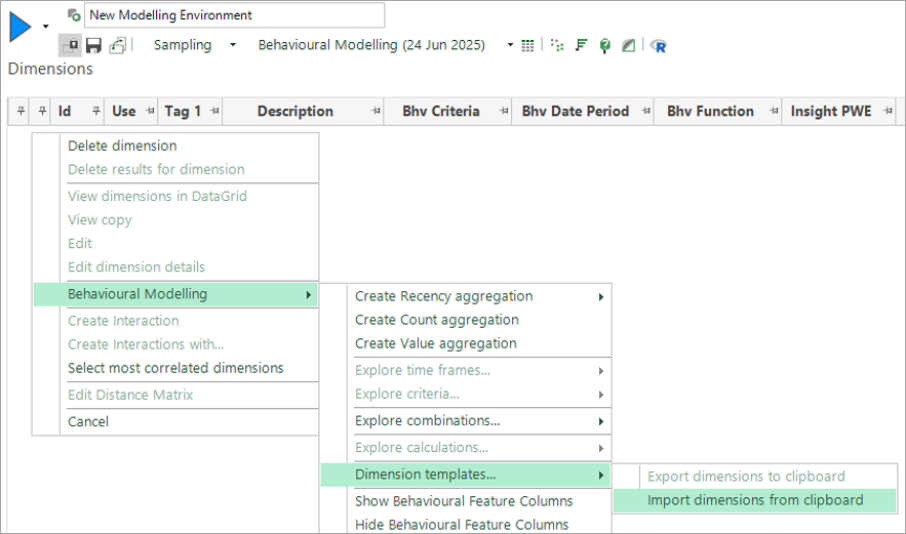
In the new system, open a new Modelling Environment and use the right-click menu options on the Dimensions tab to import the template you have just copied:
You will receive a confirmation message saying that the dimensions have been successfully imported:
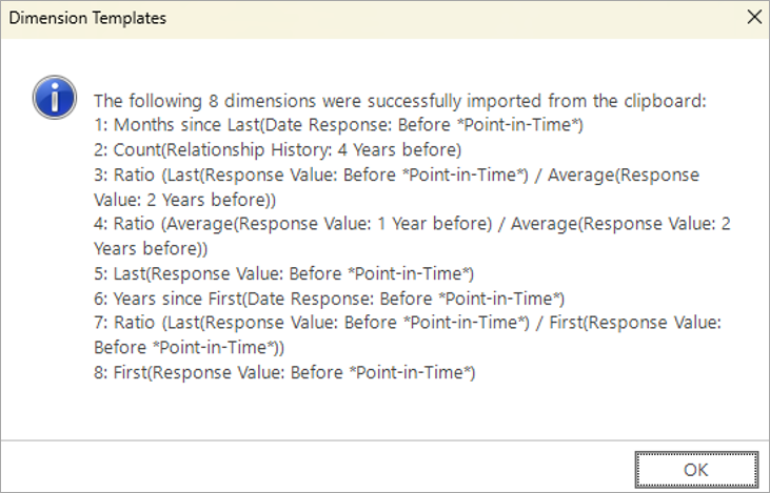
As with all the behavioural modelling menus, you now get the option to add or discard these new dimensions:
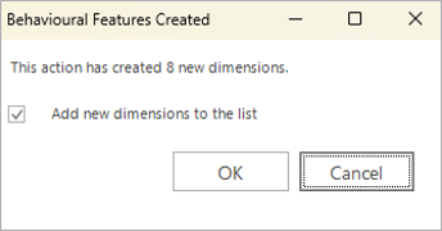
Click OK to add these to the modelling environment:
Using the behavioural model in the new system
The templating process is only transferring across the dimensions. The other aspects of the modelling environment need to be set up now.
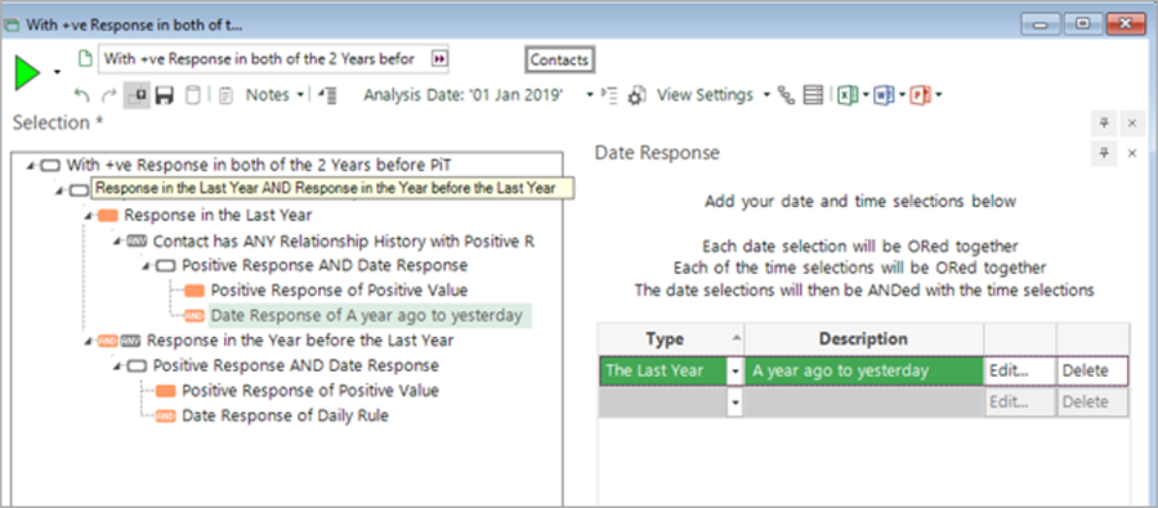
To use these dimensions, for example in a churn model as demonstrated here, you need to set up an analysis selection of people who have churned. When the model is built, these dimensions characterise the differences between people who have churned and those who have remained loyal supporters.
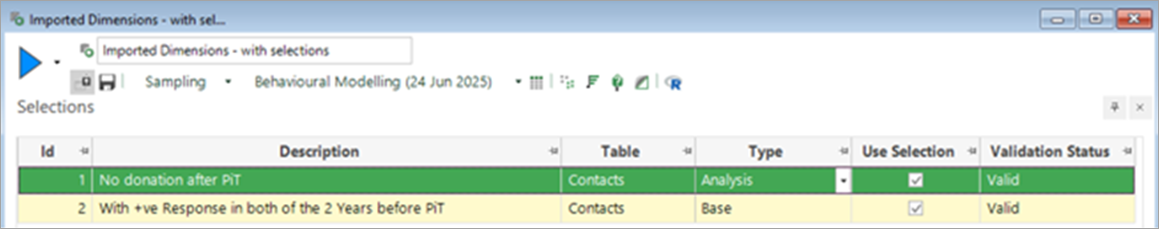
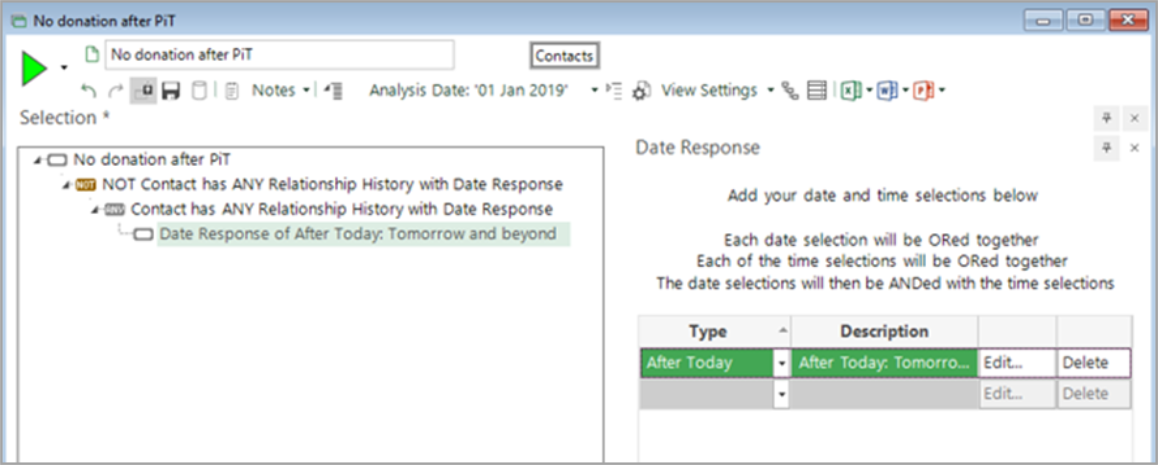
A simple way to identify people who have churned is to use an analysis selection of “people with no future donation”. Note that behavioural modelling selections must use the Today construct; this will be substituted throughout the model building process with the training, evaluation and scoring dates.
A default base selection of “All people” is provided automatically. However, typically a better model results from comparing the people who churned against a backdrop of people who are known to have made donations in the last few years.
These selections need to be added on the Selections tab, as shown below. The full definition of the selections follows subsequently:
Building the model in the new system
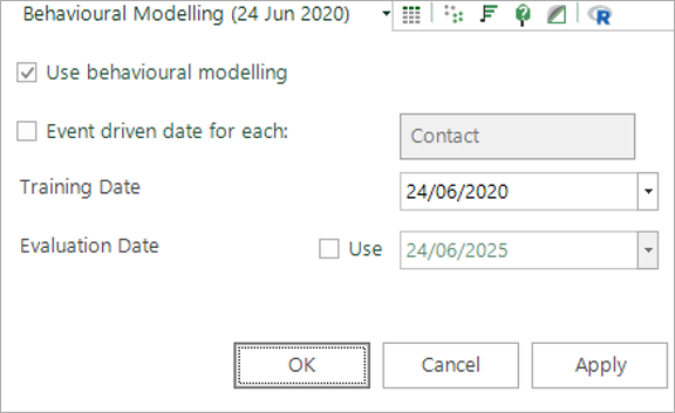
Before running the model, you should set the training date to reflect the transaction history that you want to analyse.
With a model definition of "A year ago to yesterday", the data in your system needs to contain at least two years of historical data (ideally more), and you need to develop both a training sample of one years' data and an evaluation sample of one year’s data.
You are now ready to conduct your analysis using the template imported into the new system. In this particular example:
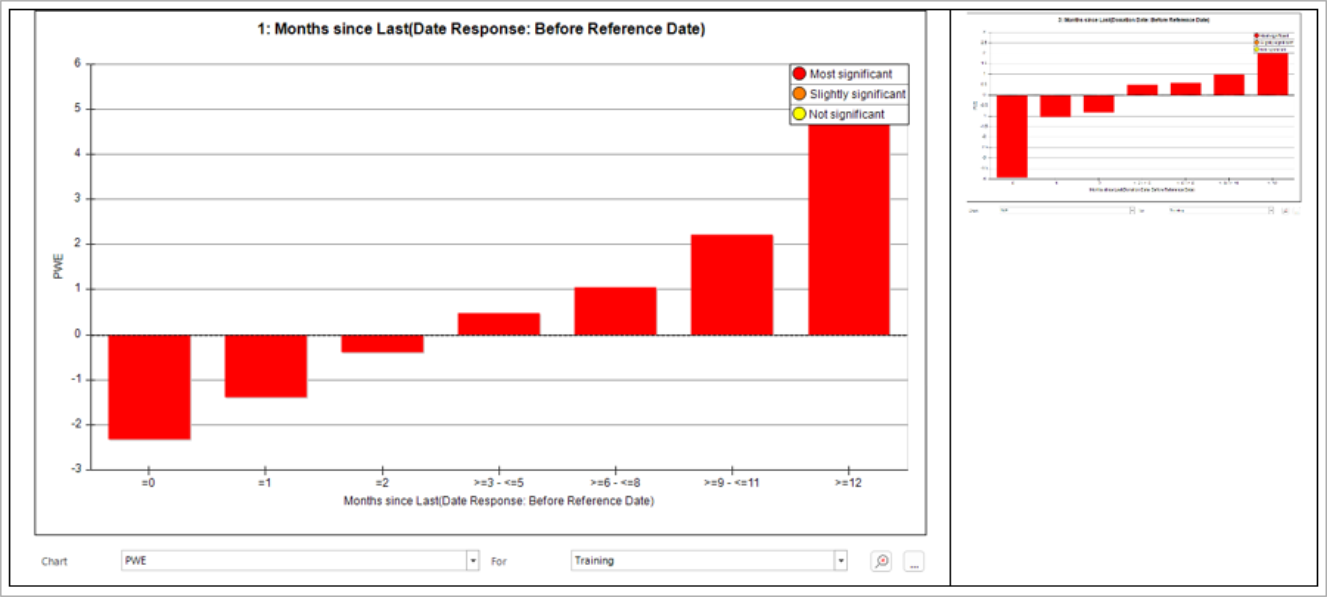
Use the Build button on the Dimensions tab to assess these behavioural features. This process will compare the analysis and base selections using these dimensions. The PWE measure highlights the key characteristics which differ between these two groups. A positive PWE indicates that a particular group of people are more likely to churn, i.e. be in the analysis selection.
The two charts below show the same dimensions seen earlier in the first system. For comparison, the smaller charts show the results from the first system. They show the same insights that we saw earlier:
-
People who have made a recent donation are less likely to churn.
-
People who have made a small change to their average donation value in the last year are also less likely to churn. It is the people who have made a large decrease or increase who are at risk of churning.
Although the PWE coefficients are clearly different between the two systems the underlying insight or patterns are essentially the same.
The second pair of charts look somewhat different, but on closer inspection these differences are just categories which in the first system had insufficient data on which to form significant inferences.
The important principle is that the features identified on one charity system can be used on a second system to identify supporters likely to churn. Note that both these systems are based on real charity data (from different sources).
Evaluating the model
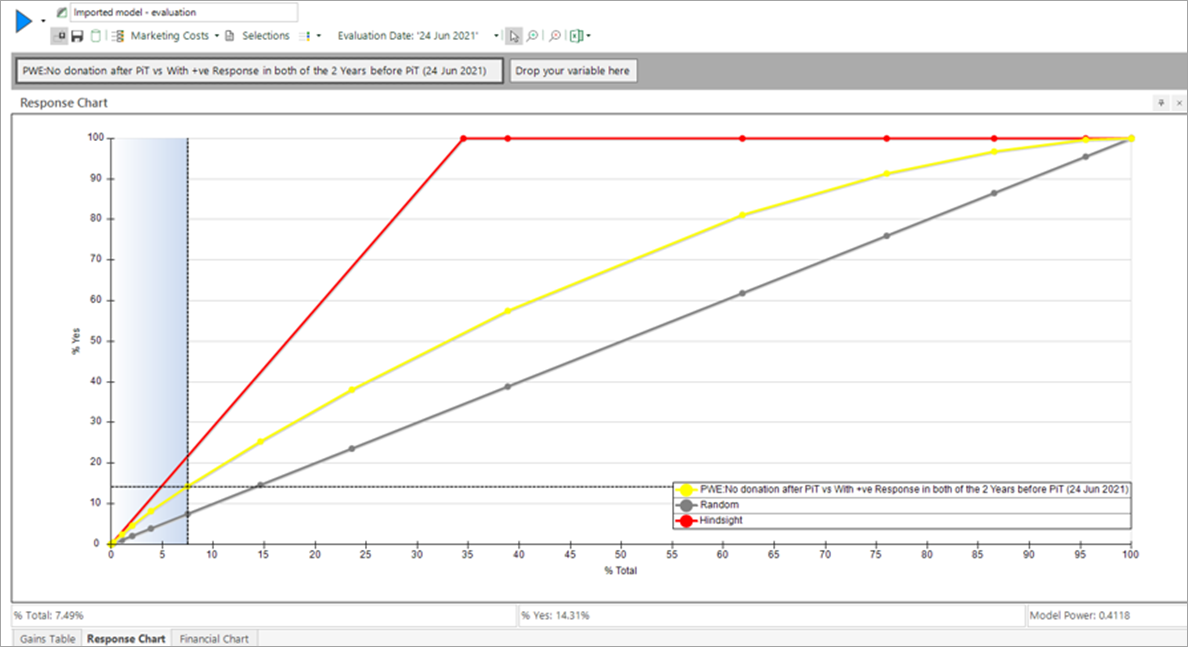
When this model was evaluated, it gave a 2-fold gain, based on targeting the top 7.5% from the model.
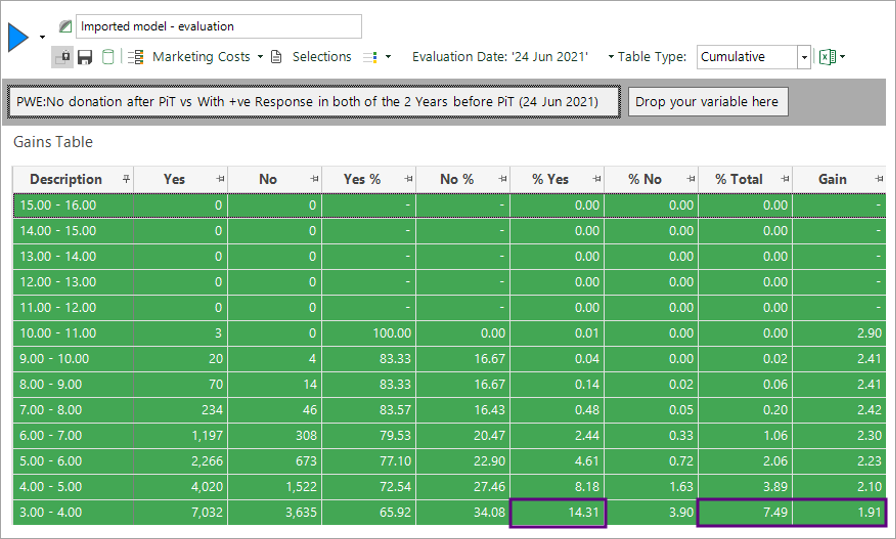
Graphically this is shown below. The highlighted point on the model would target about 7.5% of supporters (x-axis) and would reach 14.3% of people who were later known to have churned (yellow curve on y-axis). This is double (1.9x) compared to what you would expect (i.e. 7.5%) from random targeting (the grey line).
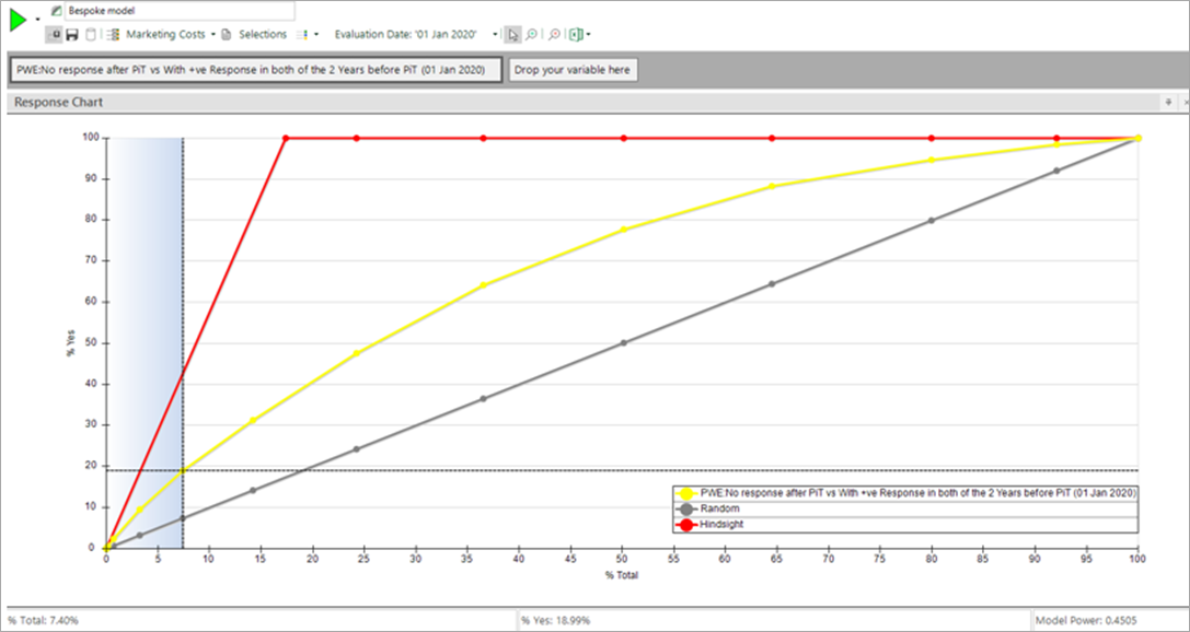
Interestingly, a bespoke model created directly on the second system, gave only slightly better results:
Scope of current implementation
First iteration templates can only contain one instance of each place-holder:
-
Grouping table - the person table (or level at which model is created)
-
Transaction table - a table linked to the grouping table which contains the transactions
-
Transaction date - a date or datetime variable associated with each transaction
-
Transaction value - a numeric variable associated with each transaction
-
Transaction selector - a selector variable giving the type of each transaction
-
Transaction category - one of the categories of the selector variable (e.g. used in criteria)
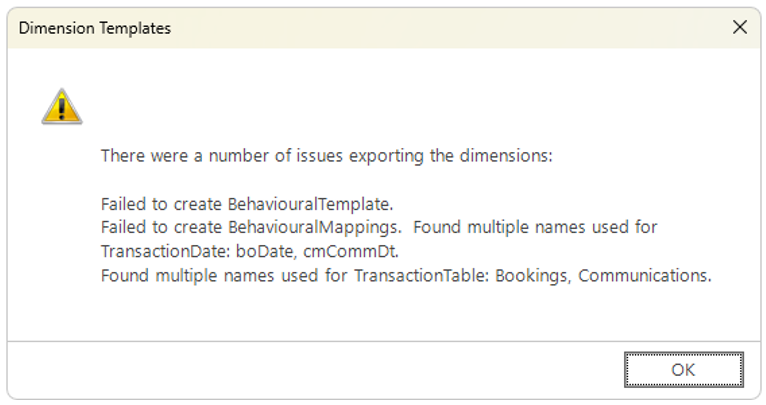
It is not possible to have a mixture of transaction tables, or multiple variables of the same type in the same template. This is because the mapping section of the template relies on the specification of a single name against each place-holder. For example, %TransactionTable% = Bookings. A warning is provided:
It is, however, possible to export multiple groups of dimensions and to then import these separately into another system.
Note that, because of the restriction on only a single transaction category being templated, it is not possible to template features based on combinations. Any criteria used in features must only reference the single category which is in the template. For example, criteria could specify “Donation Type = Non-legacy".
Administration - turning the templates feature on
Behavioural modelling templates must be enabled by an administrator using the FastStats Configurator before the option is visible in the user interface.
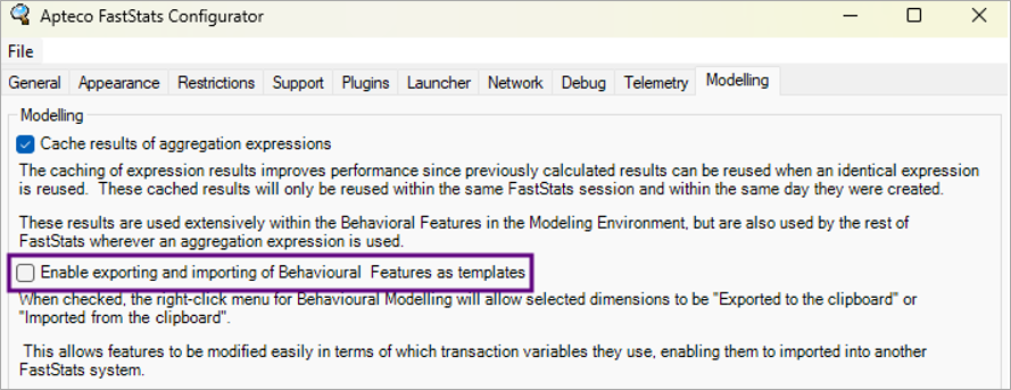
Templates are turned off by default. Your FastStats Administrator can enable them using the Modelling tab of the FastStats Configurator. Changes made here affect all users of that system.
Return to What is behavioural modelling?