Modelling Environment: How do I check the association between possible variables?
When creating a model using a variety of variables you need to be aware of any close association between those variables. If you use multiple associated variables you multiply the strength of that information in the PWE calculation and bias the result. You can observe this relationship on the Association tab of the Dimensions tab in the Modelling Environment tool.
-
Drag the Modelling Environment tool on to the workspace and click on the Dimension tab
- Drag on the variables you wish to use/explore
on to the top half of the window and click the
 Build button
Note:
You can right-drag and band numeric expressions onto the Dimensions panel of the Modelling Environment in order to evaluate their usefulness, but these do not form part of the Association check. See - Modelling Environment: Evaluating Numeric Expressions for more information.
The figures in the Association Matrix can run between 0 and 1. The closer the result is to 1 the closer the association between the 2 variables. For example you might find that age band and income band are quite highly associated and choose to use only one of these variables when building a Profile score.
In the screen shot below a number of variables indicating location have been used and as you would expect a high association has been determined e.g. Postal Area v Town has a score of 0.96.
_785x562.png)
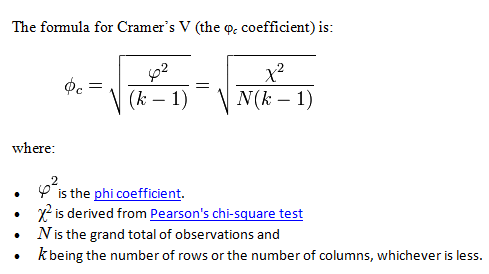
The association matrix displays the Cramer’s V measure of association. The Cramer’s V measure varies between a value of 0.0, for variables that are completely unrelated to 1.0 for variables that are perfectly associated.
For example, The Cramér's V between Income & Occupation is 0.14, showing a small degree of association between the 2 variables. It is calculated from the chi-square statistic of the Income x Occupation cube, adjusting for the sample size (e.g. 1156533) and the number of rows or columns (e.g. 11 occupations).
