Territories Wizard: Overview
The Territories wizard provides a mechanism for creating maps which are thematically shaded according to number of people, or some other metric of your choosing, such as average holiday cost, for example.
There are three ways to work with this wizard:
-
Create territories from shapefile
Create a virtual variable directly from a geographic shapefile, based on an expression, and categorising each record into the shape to which it belongs. A related JSON shapefile is simultaneously created and allows immediate use of that variable on a shaded map.

Map showing number of people by Postal Area
-
Create territories from map
Create a virtual variable directly from selections made on a map. This allows you to quickly generate territories defined by the Map drawing tools, or through the use of drivetime selections.
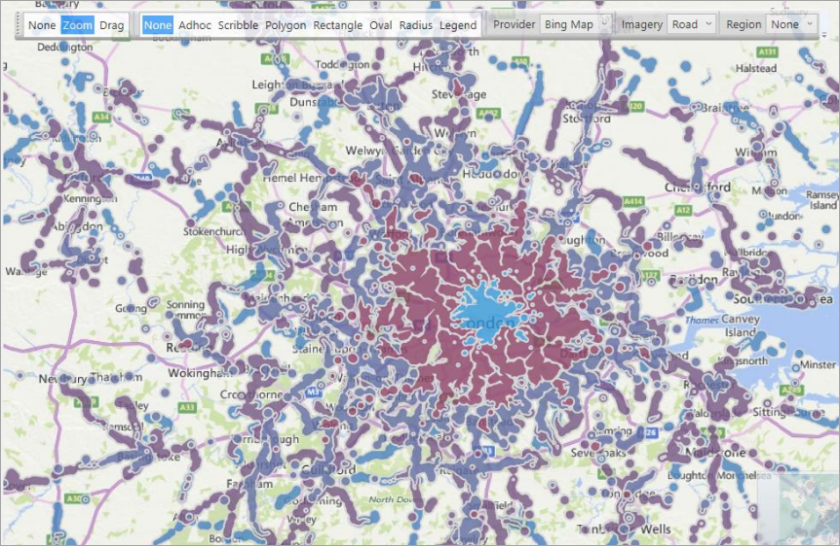
Map showing 30 minute public transport intervals from the National Gallery in London
-
Create shapefiles for existing variables
For existing virtual variables, there are options to link to a shapefile, or retrofit to a Drive Zone virtual variable.
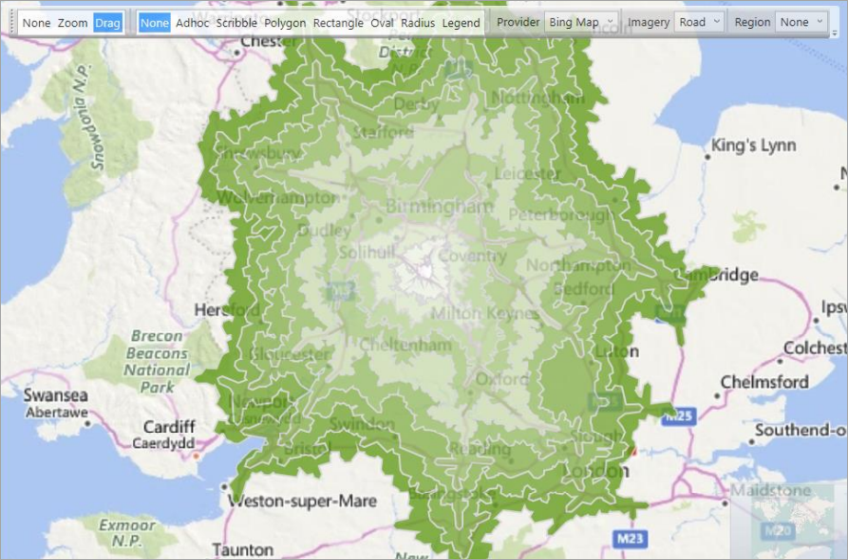
Map showing ten drive zones around the Apteco offices in Warwick
Each shape on the map represents an area and is coloured according to the defined value. You can use standard postal geography shape files - such as Postal Sector, Postal District and Postal Area in the UK; you can also create thematic maps based on alternative shape files, or your own custom territories.
Examples of shape files available from the Office for National Statistics Open Geography portal include:
-
Health region boundaries
-
Census boundaries
-
Political or electoral boundaries
-
National Parks
-
Economic regions
-
Police force areas, etc.
To create a thematically shaded map, the territory definitions must be SHP, KML or JSON format files and, importantly, you must have a variable in FastStats which matches each record to an area on the map. This means that there must be a link between the codes/descriptions of the variable in FastStats and the shape file you use.
The following example demonstrates how to use the Territories wizard with a JSON file of UK regions to generate a virtual variable that you can then use to create a thematically shaded map visualisation.
To get started:
-
From the Wizards ribbon bar, select the
 Territories wizard to go to step 1 - Bing Map Territories