Expressions: List Functions
The following List functions are available to use in FastStats' Expressions:
RankList
This function can be used to find out the rank of a value in a list of values. Although not restricted to the case described here, the most common use is to rank Expressions in Derived Cubes.
- RankList(numeric, “direction”, “tie strategy”, list) - NUMERIC
Where:
Parameter 1 is the number to rank
- if this number is not in the list then the result will be missing value
Parameter 2 is the direction of ranking
- either “ascending” or “descending”
- single letter “a” and “d” can be used
Parameter 3 is the way to break ties
- either “competition” or “dense” are the allowed strategies
- single letter “c” and “d” can be used
Parameter 4 is a numeric list
- currently such a parameter uses one of the CubeRange/PeriodToDateCubeRange Expression functions
Example
To rank across a whole dimension:
-
Create a Cube and add Income as a dimension
-
Create the following Expression:
_538x49.png)
-
Drag the Expression into the middle of your Cube and build:
.png)
NTileList
This function can be used to find out the Ntile of a value in a list of values. Although not restricted to the case described here, the most common use is for calculating Ntiles in Derived Cubes.
-
NTileList(numeric, “direction”, number of tiles, list) - NUMERIC
Where:
Parameter 1 is the number for which to work out the Ntile
- if this number is not in the list then the result will be missing value
Parameter 2 is the direction of ranking
- either “ascending” or “descending”
- single letter “a” and “d” can be used
Parameter 3 is the number of Ntiles
- typically this is 100, but you can choose any numeric you like
Parameter 4 is a numeric list
- currently such a parameter uses one of the CubeRange/PeriodToDateCubeRange Expression functions
Example
To create NTile across a whole dimension:
-
Create a Cube and add Income as a dimension
-
Create the following Expression:
_502x40.png)
-
Drag the Expression into the middle of your Cube and build:
.png)
FilterList
This function takes a list of values and removes some of its values. The primary use case is to filter outlier values from a list of values.
-
FilterList reduces the set by selecting based on value
-
FilterList (Lower,Upper,Include,{List}) - LIST
- ‘lower’ and ‘upper’ are both numeric values
- if Include is true then include Lower <= x <= Upper, otherwise exclude this range
- the List parameter is created from a CubeRange/PeriodToDateCubeRange Expression function
Example
To find the max of Destinations but filter out values < 1000 and > 100000:
-
Create a Cube and add Destination as a dimension
-
Create the following Expression:
_530x42.png)
-
Drag the Expression into the middle of your Cube and build:
_500x726.png)
TrimList
This function takes a list of values and removes some of its values.
-
TrimSet reduces the set by selecting based on number of items
-
TrimList(Lower,Upper,Include,{List}) – LIST
- if ‘lower’/’upper’ is an integer, drop this exact number from bottom/top of sorted set
- if ‘lower’/’upper’ is fractional (0 < x < 1), drop this fraction from bottom/top of sorted set
- fraction rounds down to nearest whole number of items
- if include is true then include Lower <= x <= Upper otherwise exclude this range
- the List parameter is created from a CubeRange/PeriodToDateCubeRange Expression function
Example
To find the max of Destinations after removing the top-most / bottom-most value:
-
Create a Cube and add Destination as a dimension
-
Create the following Expression:
_757x21.png)
-
Drag the Expression into the middle of your Cube and build:
_493x716.png)
CountList
This function allows you to count the number of elements in a given list.
Example
To create a simple count list, first create the following Expression:
_311x26.png) - gives a value of 2
- gives a value of 2
Example
To count the number of values on a Cube dimension with a value below 100,000:
-
Create a Cube and add Destination as a dimension
-
Create the following Expression:
_619x42.png)
-
Drag the Expression into the middle of your Cube and build:
CreateList
This function allows you to create a list object from a set of values or lists. The return type of the function is a list and it therefore needs to be used inside a function that acts upon a list.
Example
To create an average from the horizontal and vertical slice through a Cube’s cell:
-
Create a Cube with a dimension of Destination (vertical) and Gender (horizontal)
-
Create the following Expression:
_694x41.png)
-
Drag the Expression into the middle of your Cube and build:
.png)
ListContains
This function allows you to test whether a given list contains one of a number of values. The return value is 0 if none of the test values are matched or, otherwise, the index of the matched value (i.e if it matches 1st value = 1, 2nd value = 2, etc).
Example
To create a simple ListContains example:
_414x24.png) - returns 2
- returns 2
Example
Based on a Cube, the following Expression returns 1 if the people in that cell have been to all 20 destinations between them, or 0 otherwise:
-
Create a Cube with a dimension of Income (vertical) and Occupation (horizontal)
-
Create the following Expression:
_729x41.png)
-
Right-drag the Destination variable into the middle of the Cube and add Count Distinct(Destination) as a statistical measure
-
Set the Omit Zero Axes property off
.png)
-
Drag the Expression into the middle of your Cube and build:
_1228x427.png)
Other list functions include:
TextListContains
This function searches the text list for the values String1, String2, etc. and returns the index of the first match found. Returns 0 if no match found.
StrList
This function turns a numeric or text list into a delimited string. An optional delimiter can be specified in a second parameter.
CreateTextList
This function creates a text list. The values in the list are either strings or text lists. This function must then be used as a parameter in a function that takes a text list.
For example:

Results in an output of:
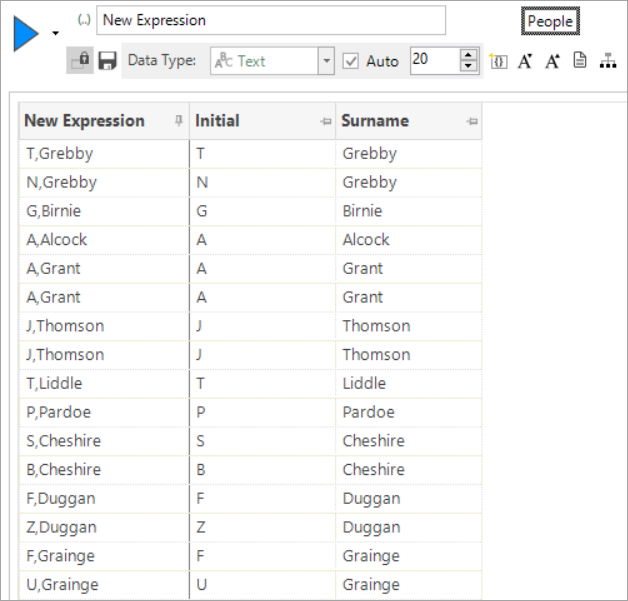
Added in Q1 2024
TextListMapping
This function returns a text list. The values in the input text list each have a mapping function applied to them. This function is referred to by a name and options include, for example, mapping postal sector and district to the usual FastStats variable formats, converting the values of an input file to all upper case, or all lower case.
See Expressions: Mapping options for List and File functions for a complete list of the mapping options.
Added in Q3 2025
LinearTrend
Linear trend analysis allows you to examine increases and decreases over time in a more precise way than by using the RankCoeff function - for example, to see which of your products are becoming more or less popular. The LinearTrend list function calculates the linear trend across two lists of numbers - one representing the X-values, and the other the Y-values. This function is particularly useful when working with lists of values, often across a date dimension in a cube, across an individual product (such as destination), as a cube derived expression.
The cube below demonstrates how you can use the LinearTrend function to examine the increases or decreases in the average cost of bookings to different destinations over a period of six years.
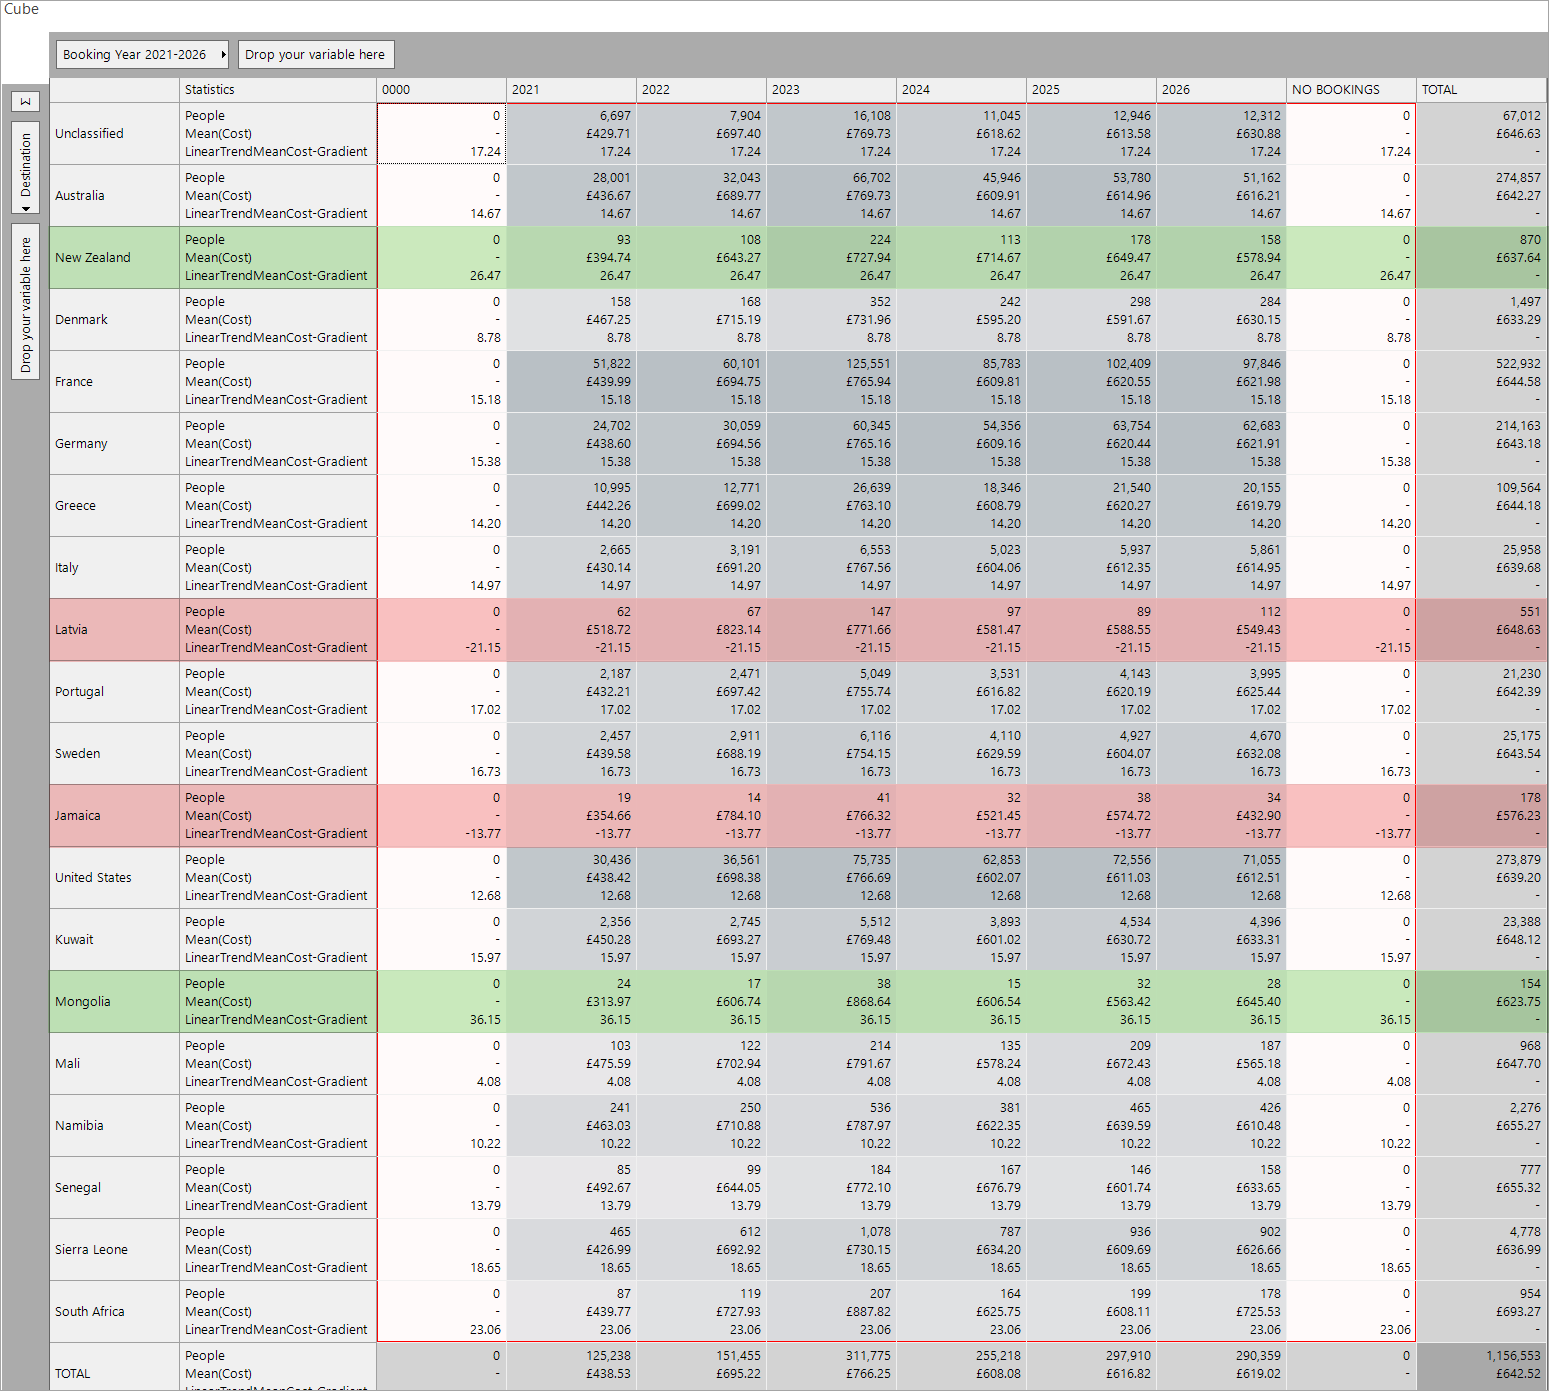
Based on calculating the gradient of the linear trend line for mean of cost for each destination visited over the 6-year period, the results highlighted in red indicate that there are just two destinations - Latvia and Jamaica - which show an average decrease over time of -£21.15 and -£13.77 for each year respectively. At the opposite end, highlighted in green, New Zealand and Mongolia are the highest increasing destinations.
The expression used in this example is:
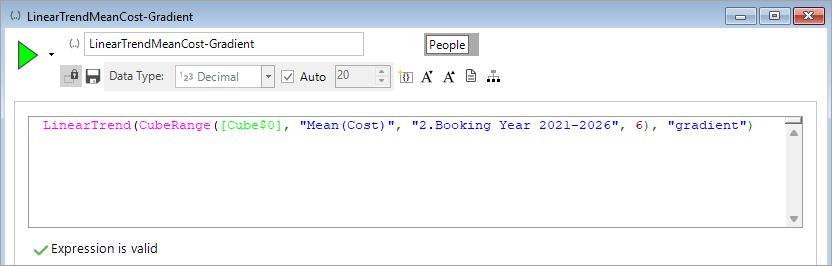
The LinearTrend algorithm can take multiple parameters. They appear in the following order, but only (2) and (4) are mandatory:
-
X list - a list of X values. If not specified, it will be matched to a list of Y values as a set of integers from 1...2...3...N.
-
Y list - a list of Y values and always present.
-
Intercept - a double value representing the value of the intercept which, if not specified, can be calculated from the line of best fit. If it is specified, then the line of best fit will go through this intercept value.
-
Property to return - provides the value to return. Acceptable values are:
-
"gradient" - the slope value, e.g. if positive the trend is upwards
-
"intercept" - the value of the intercept; this is sensible if it's not specified in the expression
-
"rsquared" - a measure of how well the best-fit line matches to the points
-
"calculate" - to return the value at index X for the trend line
-
-
X value - only relevant with the 'calculate' option and is the X index on the best fit line.
The expression has removed the need for you to manually calculate the X list values but, typically, you would not want to include the whole dimension as this might include periods of time without relevant data. As such, in the example above, the start point is index 2 (2021) and there are six years' worth of values - hence the size is 6. For a monthly banding over six years, the size value would be 72.
Back to Expressions: Overview