Expressions
You can use an expression in a data grid. Simply make an expression using the expression editor, and left-drag it onto the data grid by its drag handle.
The diagram below shows a data grid that uses an expression as a column.
.png "Expression as a data grid column")
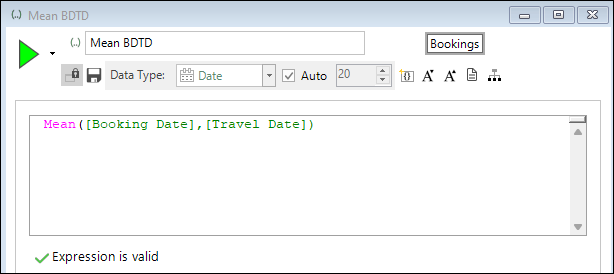
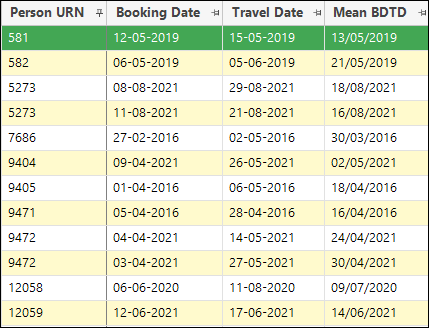
In a similar way, you can add date/date time expressions into a data grid. For example, let's imagine that we want to identify the average for a person's booking date and travel date.
-
Create the expression.
-
Left drag the expression onto a data grid by its drag handle and build.
Banded date or datetime expressions
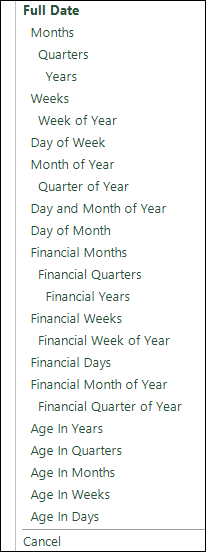
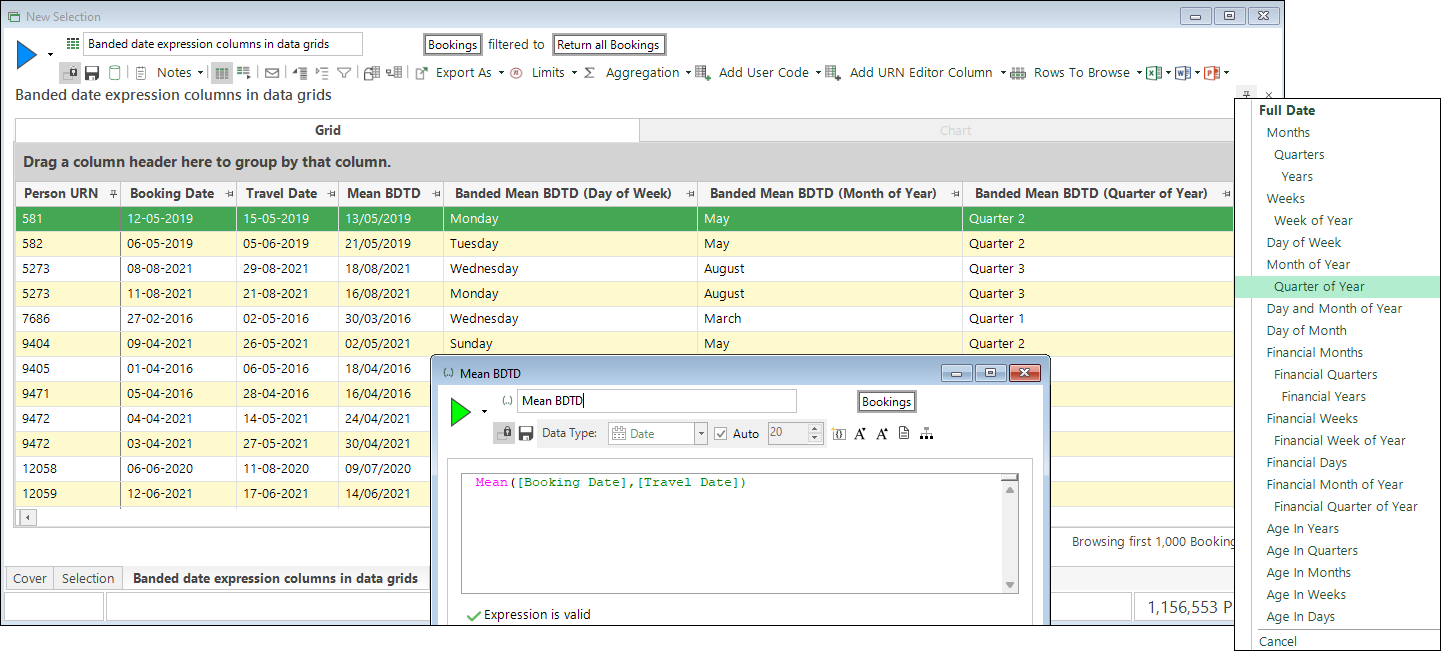
You can create and use a banded date or datetime expression as a column in a data grid. To access the banding options:
-
Right drag your expression onto a data grid and select the required banding.
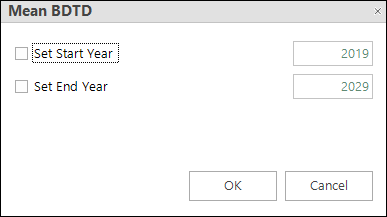
Once you select your banding option, you are presented with a second dialog in which you can set the start and end year for your date expression. By default, the start year is 2000 and the end year is five years from the current year.
Note
Dates outside your selected start and end year range show as unclassified in the data grid.
-
Build the display.
Note
Significantly, this ability to add a banded date/date time expression directly as a column into a data grid removes the need for you to create a virtual variable.