Expressions: Aggregations On The Fly - Pattern Match Return Value On Transactional Table
The Pattern Match functionality of on the fly Aggregations allows the value to be returned on the transactional (child) table as well as the grouping (parent) table.
Allowing a value to be returned for every transaction a person makes brings two main advantages:
1. Previously difficult or impossible pattern match analysis can be carried out
Imagine you want to select people who have a destinations visited pattern of Australia-United States that starts on their 7th transaction:
2. Returning the value on the transactional table and then aggregating that value can provide a better overall indication of a person’s transactional behaviour, rather than just returning one pattern value per person based on the first pattern they matched
For example, the diagram below indicates very different transactional behaviour from each of two individuals:
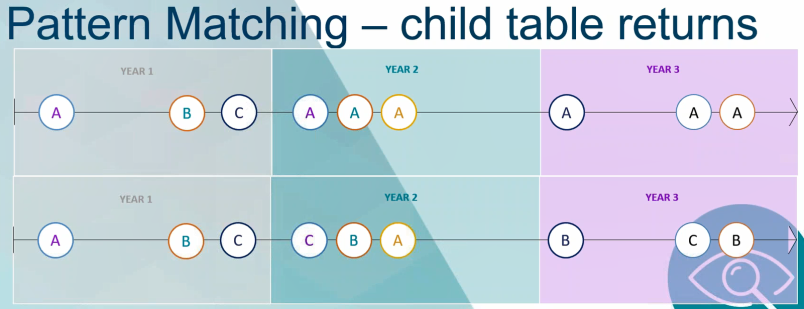
To examine people’s propensity to go to different destinations, you can create a Pattern Match to identify the longest consecutive sequences of different destinations visited.
In FastStats, the ‘on the fly’ Pattern Match set-up is:
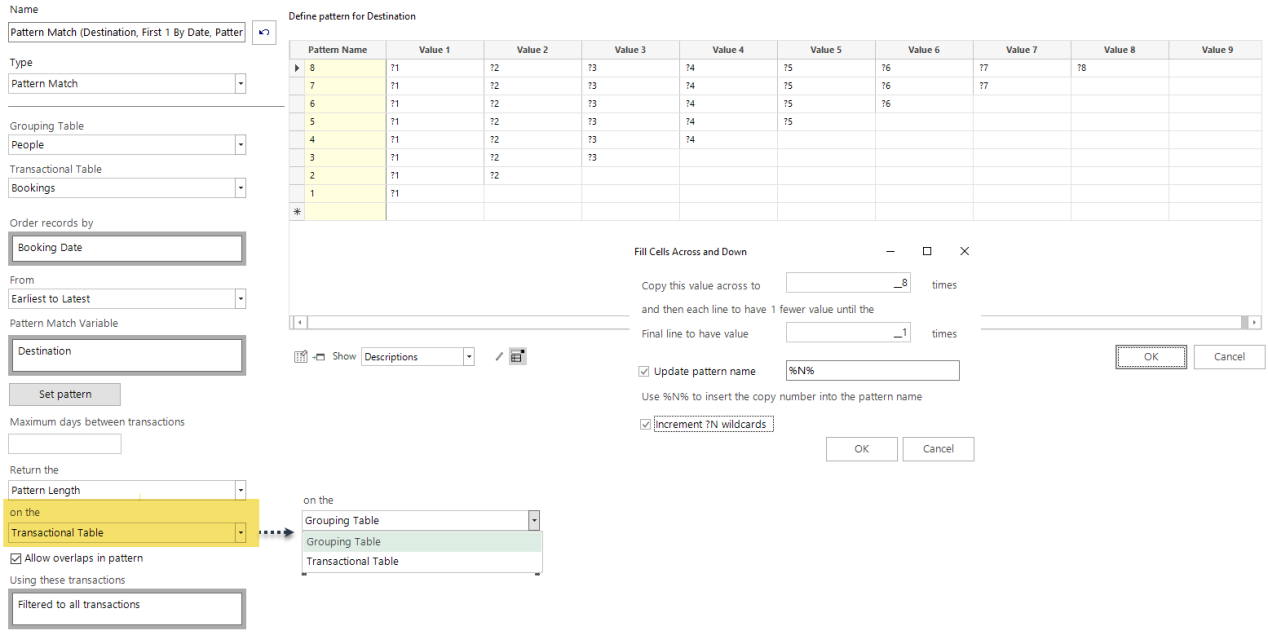
Note 1: Enter ?1 into the Value 1 cell and then right-click and select Fill Cells Across and Down to complete the set-up as shown in screenshot above.
Note 2: The new element ‘Transactional Table’ is present to select from the “on the” drop-down.
Note 3: As you are counting transactions, the expression table level must be set accordingly – e.g. Bookings.
By selecting and carrying out this analysis on the Grouping Table, FastStats would return the following:
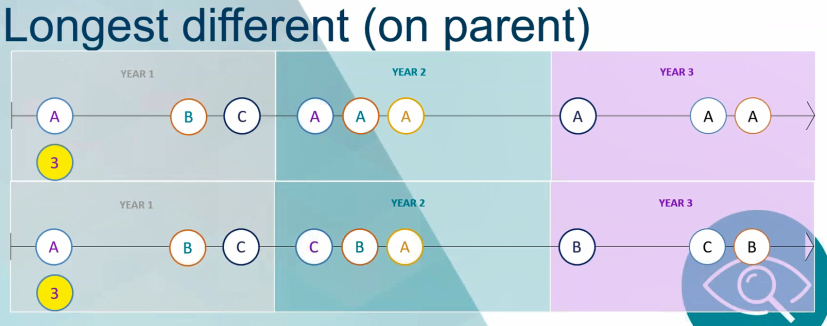
For each person, the longest pattern sequence with distinct (i.e. not repeated) transactions in their transactional history is 3. This is returned as a single value on the Person (Grouping) table. As a marketer, you might then market to them on the basis that they each tend to behave with 3 transactions as a longest distinct sequence, even if they have different destination combinations within the pattern of 3.
However, if this same information is analysed on the Bookings (Transaction) table for each and every transaction, the results would be:
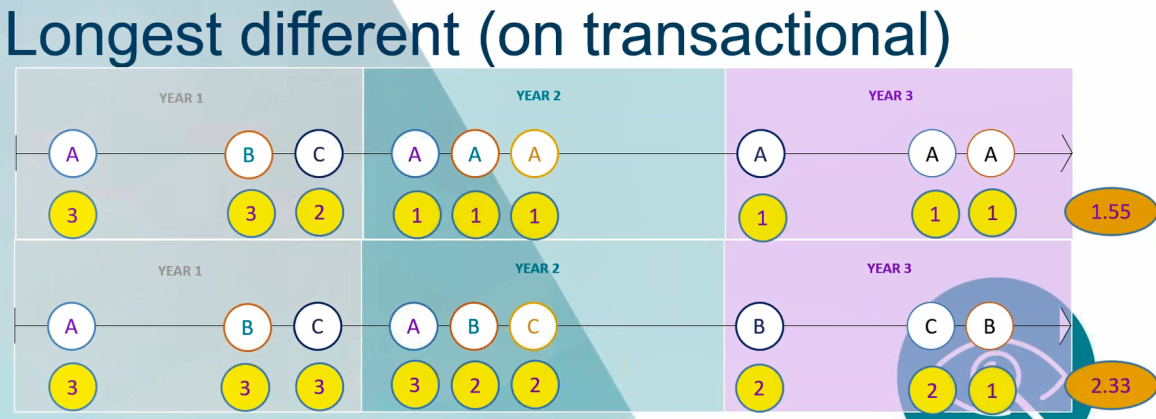
Here, the system returns a value for the longest sequence at that point – i.e. each number corresponds to the sequence of distinct transactions from each starting transaction type. For example:
Person 1
Year 1 – A = 3 because there is a pattern of ABC before A is repeated
Year 1 – B = 3 because there is a pattern of BCA before A is repeated
Year 1 – C = 2 because there is a pattern of CA before A is repeated
Person 2
Year 1 – A = 3 because there is a pattern of ABC before A is repeated
Year 1 – B = 3 because there is a pattern of BCA before B is repeated
Year 1 – C = 3 because there is a pattern of CAB before C is repeated
Because the system returns a value on each transaction, the aggregation to the Person level returns very different scores and allows a much more granular differentiation. In this example, person 1 with a score of 1.55 demonstrates a much higher propensity to repeat transact than person 2 with a score of 2.33. You can then choose how best to market to each individual.
In the example below, we combine the ‘on the fly’ Pattern Match functionality created above with a FastStats Cube to examine if there is a relationship between a person’s income band and their likelihood to go to different destinations.
-
Open a new Cube and add Income as a dimension
-
Right drag the Number of Bookings variable into the Cube and select Mean
-
Create the ‘on the fly’ Pattern Match as per the screenshots shown above and name the Expression e.g. Propensity to Repeat Transaction
The date options within the Pattern Match set-up window disappear when you return on the Transactional Table as they are no longer relevant
Remember to select Allow overlaps in pattern because you want to return a value for every single transaction
-
Right drag the Expression into the Cube and select Mean
-
Build the Cube
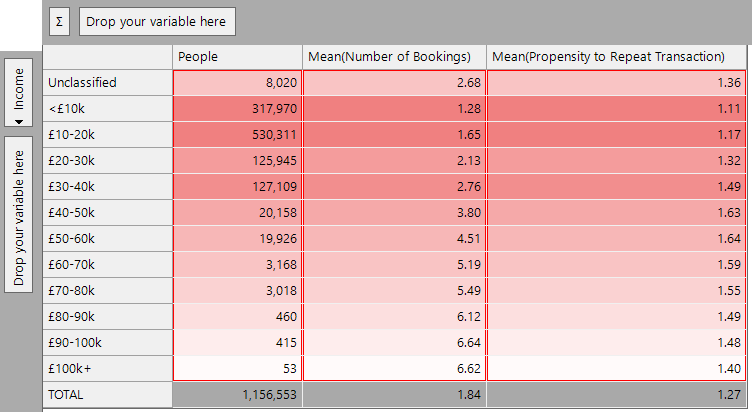
In the lower income bands, the Mean(Number of Bookings) is quite low. If a person has just 1 booking, their propensity value can only be 1. If they have just 2 transactions, the average will be 1 or 1.5 as a person has either been to the same destination (i.e. value of 1 for each transaction) or they have not (i.e. value of 2 for the first transaction and 1 for the second, distinct transaction). Therefore, where there is a small volume of transactions, the average propensity to repeat transact will necessarily also be low.
The Cube results suggest that:
As the average number of bookings increases for each income band up to £50-60k, the average propensity to repeat transact also increases. After this, the mean propensity drops off. This infers that people in the higher/highest income bands are actually more likely to go to the same holiday destination(s), even though they have more opportunity to visit different consecutive destinations; they are more likely to be conservative in their holiday choices. It is this kind of behavioural insight that you can use to inform your marketing decisions.
You can use the above technique with other “Return the” Pattern Match options to answer a variety of questions including, for example, people who have a destinations visited pattern of Australia-United States that starts on their 7th transaction.
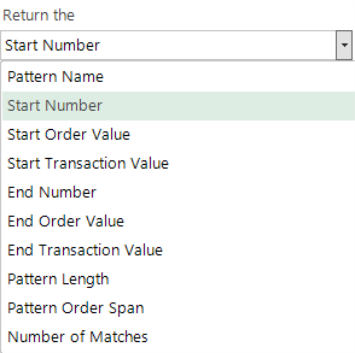
In addition to start and end values, you can also select to return an intermediate 'Nth' element of a pattern:

See also:
-
Expressions: Aggregations On The Fly - Pattern Match Any Matched Pattern
-
Expressions: Aggregations On The Fly - Pattern Match First Matched Pattern
-
Expressions: Aggregations On The Fly - Pattern Match Positional Wildcards
Click to return to Expressions: Aggregations on the Fly