Bing Maps: Penetration Mapping with Z-Scores
Added in Q2 25
Based on the capabilities of the Profile tool, penetration mapping provides valuable insight by allowing you to compare two groups of people on a map using an analysis to base index statistic. However, the results for all areas are not necessarily statistically significant. When creating a profile, this is overcome by each category having a Z-score statistic assigned to it, but only those that are significant add a score to the model. From the Q2 2025 software release, this approach can be applied to a penetration map and used to control whether or not an area is shaded. There is also a further option to shade and identify significant areas on a map using the Z-score itself.
Example 1
Only apply index shading when the Z-score of a particular area exceeds a statistically significant threshold (default +/- 3.0). Areas which are not statistically significant should not be shown.
To get started:
-
Open a new Map.
-
In the Layer 1 tab, add Postal Area as the geographic variable to use.
-
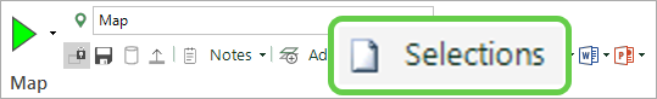
Click Selections on the map toolbar.
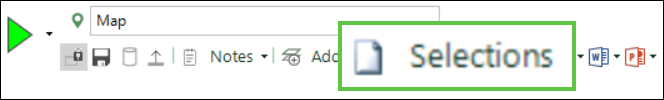
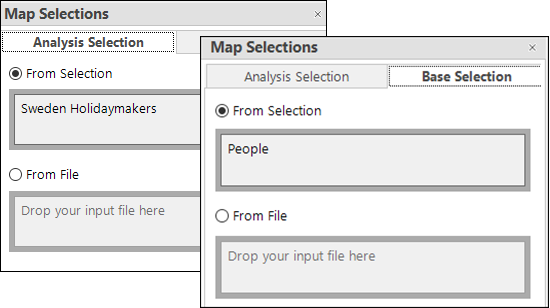
The Map Selections dialogue opens with two tabs.
-
Within the Analysis Selection tab, drag and drop a selection of Sweden Holidaymakers into the From Selection drop-box.
-
Switch to the Base Selection tab where you can see that the default is People - i.e. all people on the database. Leave as the default.
-
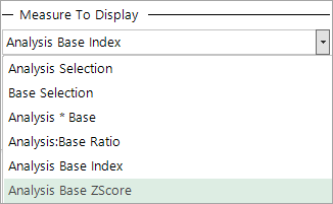
At the bottom of the dialogue you can select the calculated insight metric - in this case choose Analysis Base Index and OK.

-
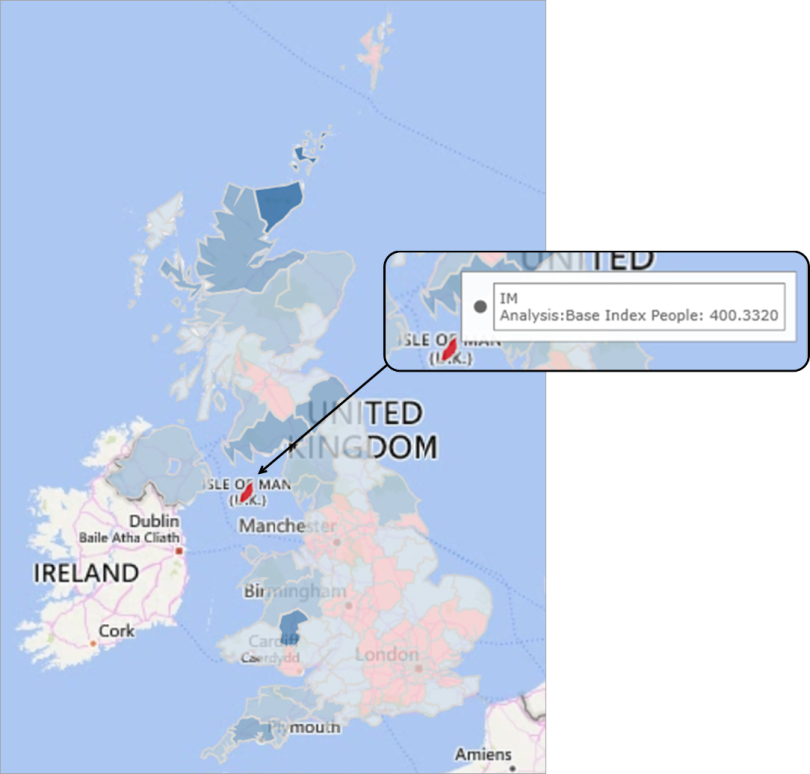
Build the map.

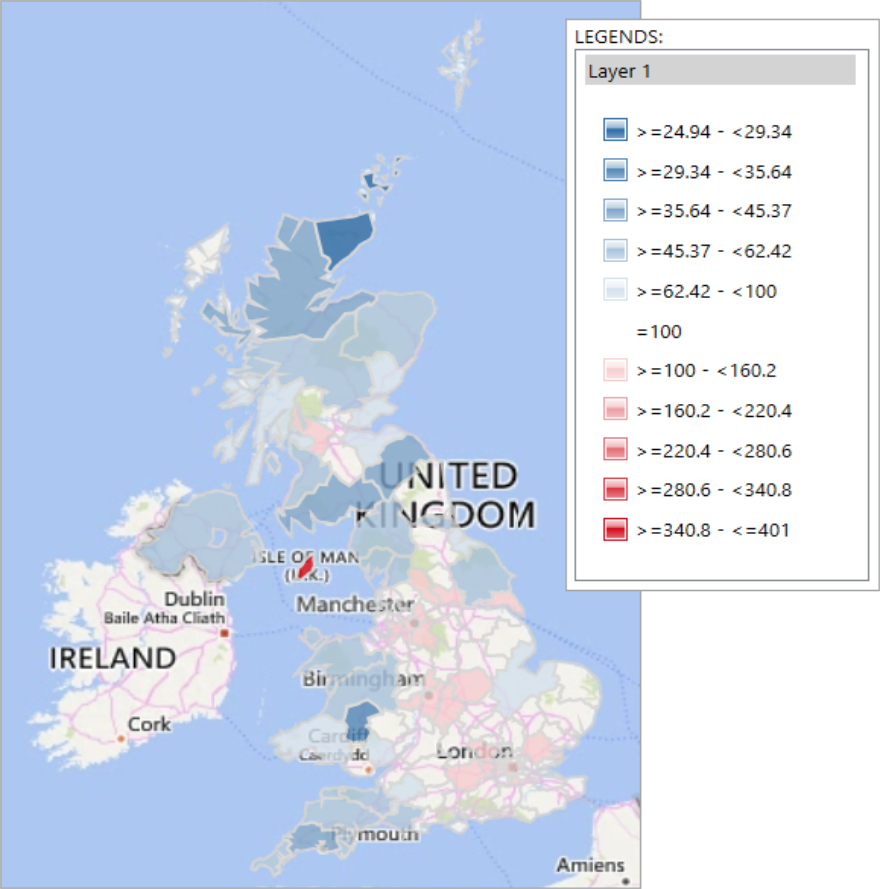
You can see that thematics have been applied and hovering over a shaded postal area displays the corresponding index value. Here, the index values indicate that the areas around London, Birmingham and Manchester have a higher penetration and mid-Wales lower, suggesting that Sweden holidaymakers are generally located in more urban areas, although there are clearly some outliers, such as the Isle of Man, Glasgow and Hull.
Applying thematic shading based on index values
To provide further insight you can choose to apply thematic shading specifically for the index measure:
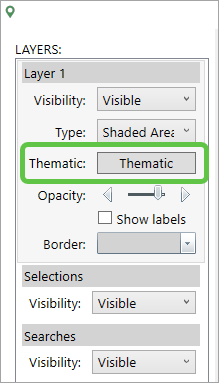
-
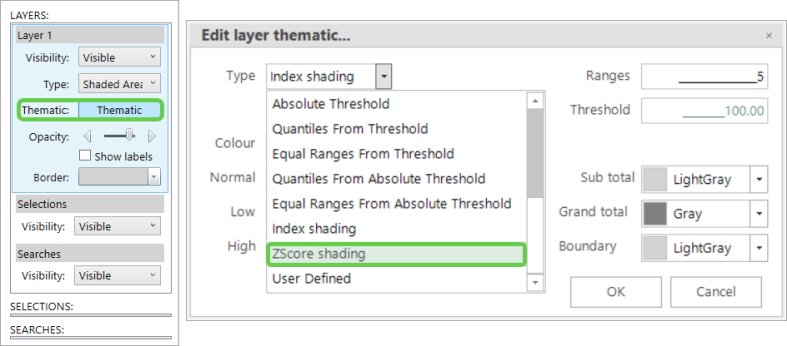
In the Layers panel, select Thematic to access the Edit layer thematic dialogue.
-
From the Type drop-down, select Index shading and set the number of ranges to 5.
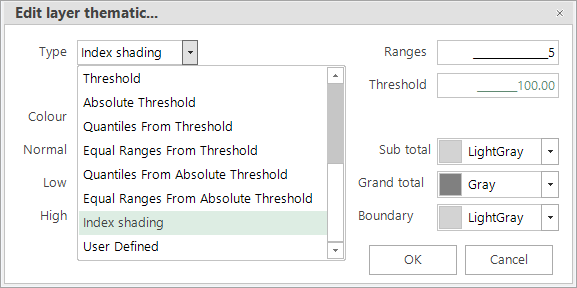
-
Select appropriate thematic colours - in this example, shades of blue for values below 100 and shades of red above.
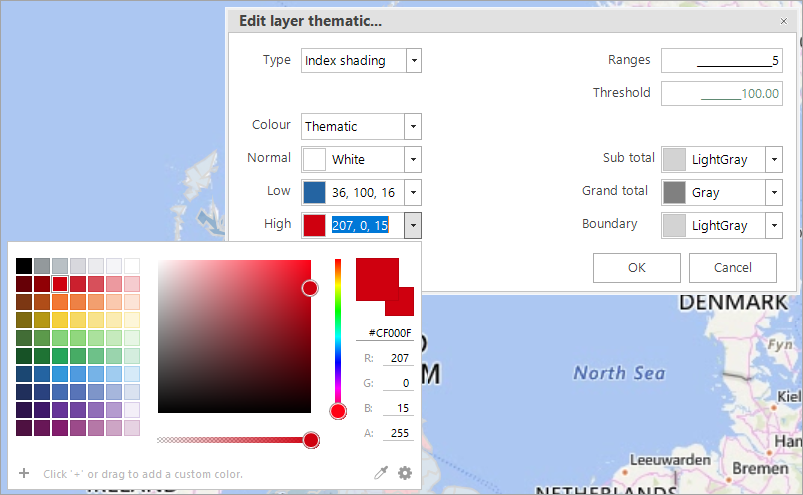
-
Click OK to update the map display.
The insight? You can clearly see the under and over representation of Sweden Holidaymakers v All People by Postal Area. Whilst representation in most areas appears to be about average, the Isle of Man is strongly over-represented and there are several areas - from Plymouth in the south west, to Llandrindod Wells in Wales and Kirkwall in Scotland which are quite significantly under-represented.
But are all these areas statistically significant?
To further investigate:
-
Click back on the Selections icon.
-
In the Measure To Display panel, check ZScore threshold and OK.
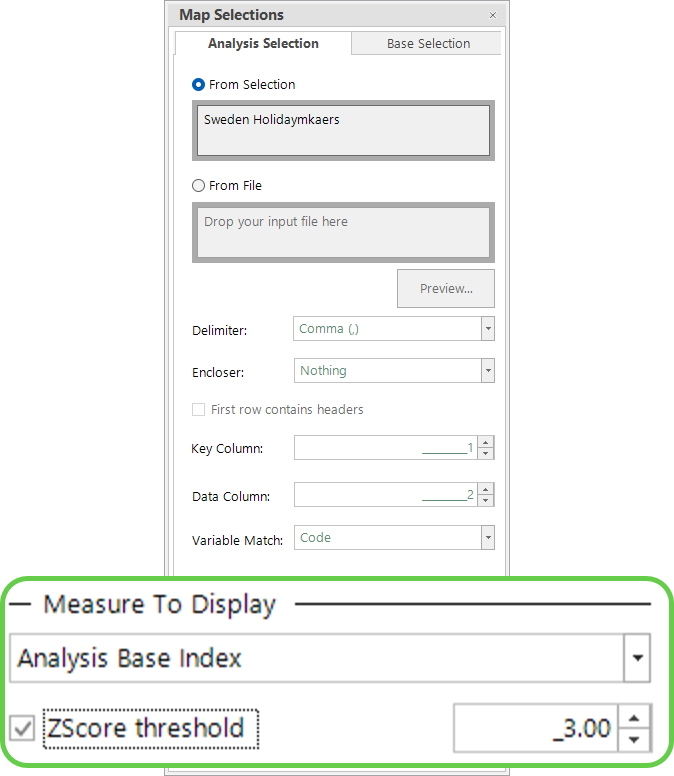
The default is +/- 3.0, but you can adjust this if you wish.
-
Build the map.
The map now only displays shading for postal areas where the results are statistically significant.
Example 2
Create a map that displays actual Z-scores.
-
Click on the Selections icon and select Analysis Base ZScore as the measure to display, then OK.
Pop-up warnings prompt you to change the thematic settings. Acknowledge these by clicking OK and then follow the steps below.
-
In the Layers panel, click Thematic and then select ZScore shading from the Type drop-down.
-
Click OK to see an updated display based on Z-score shading.
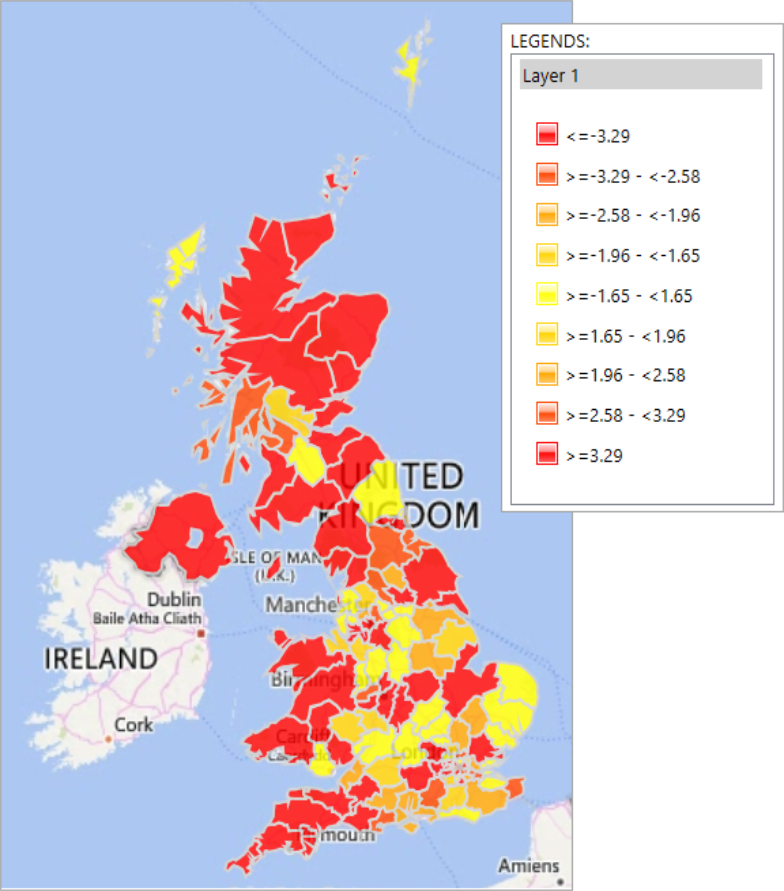
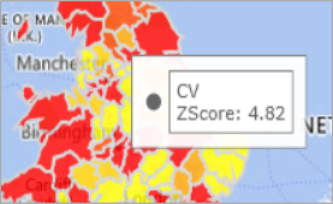
The updated map clearly displays the areas which are statistically significant - and those which are not. Hover over an area to see its Z-score.
Don't forget - you can easily convert your map into a cube, tree or word cloud using a right-drag action - see Cube: How do I switch between cube-based visualisations?. You can also select from the map using the legend - see Bing Maps: Selectable Thematic Map Legend for how-to steps.
Related topics:
Bing Maps: Penetration Mapping
Bing Maps: Penetration Mapping - comparing records against an outside population