Bing Maps: Plot Map
A plot map allows you to display records using a more precise geographical boundary and provides the opportunity to look at the location of smaller groups of customers or prospects around the country. For the greatest precision and to keep Bing transactions to a minimum, it is recommended that you use longitude and latitude co-ordinates, although it is also possible to use variables such as UK Postcode or US Zip code, and an example of this is shown below.
For details of how to create a plot map using Longitude/Latitude co-ordinates, click here.
Creating a plot map using the UK Postcode variable
To get started:
-
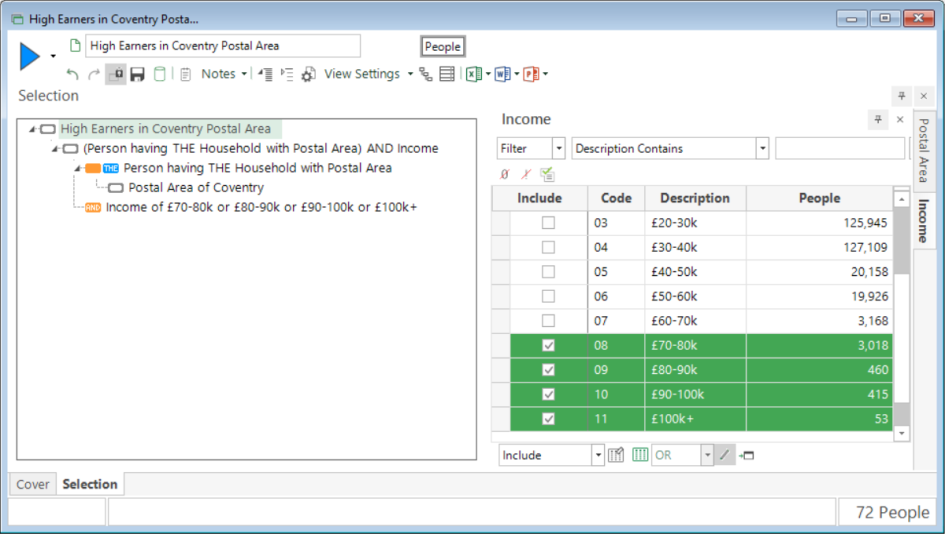
Create a selection that identifies high earners (income of £70-80k or more) in the Coventry postal area.
-
Drag and drop the Map tool on top of the selection window.
-
Click on the Layer 1 tab.
-
Change the title to High Earners in Coventry Postal Area.
-
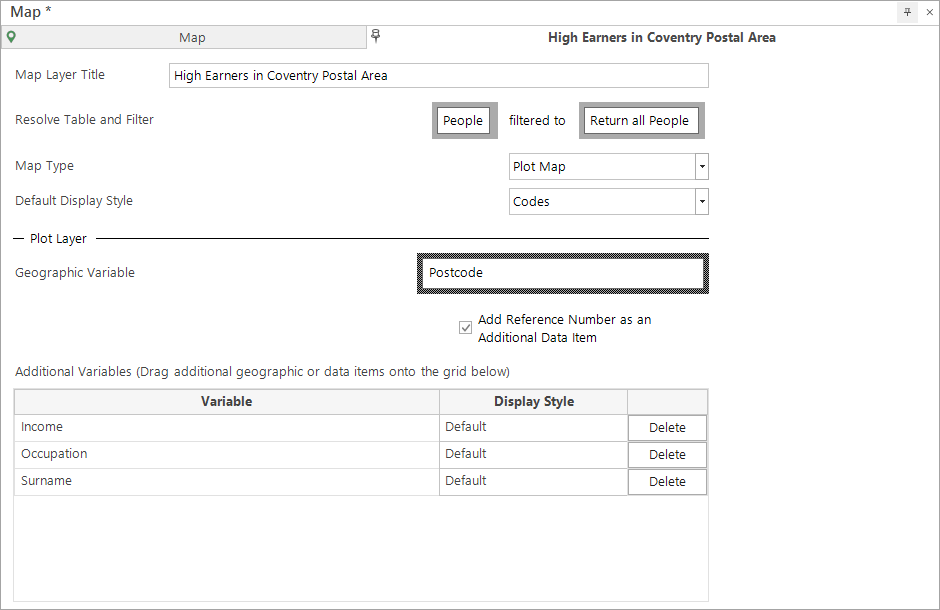
Complete the window as per the screenshot below:
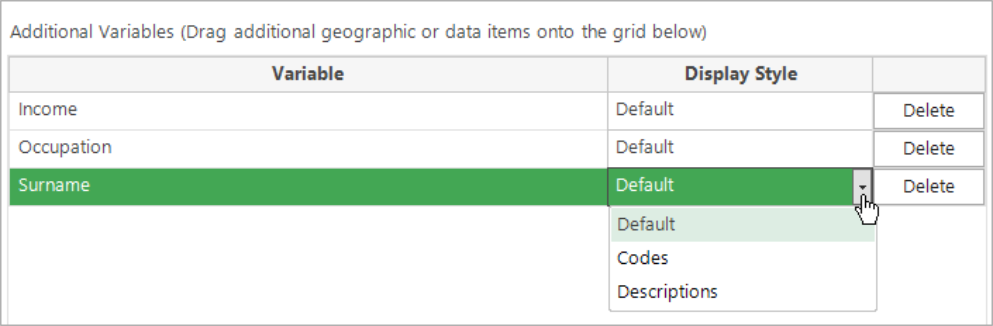
Any additional variables can display their codes or descriptions on the map by making a selection from the Display Style drop-down list. Your Administrator can set the default to either of these options.
The options for the Layer 1 window are:
| Map Layer Title: | Enter the description to be shown on the layer tab and legend display. |
| Resolve Table & Filter: | Set the table level and any record filter here to determine the records shown - e.g. People or Household figures. |
| Map Type: | Choose between the Shaded and Plot Map options. |
| Default Display Style: | When viewing the Map results, select to show the Descriptions or Codes for items. |
| Geographic Variable: | Drag and drop here the geographical variable to determine how the data will be shown on the Map. |
| Add Reference Number: | This allows a selection to be dragged off the map listing the URN(s). |
| Additional Variables: | Information for these variables can be accessed for records displayed on the map. |
| Display MapPoint Wizard for Next Build: | Displays the wizard each time the map is built so you can change the graph type and other options. |
-
Click the Build button.
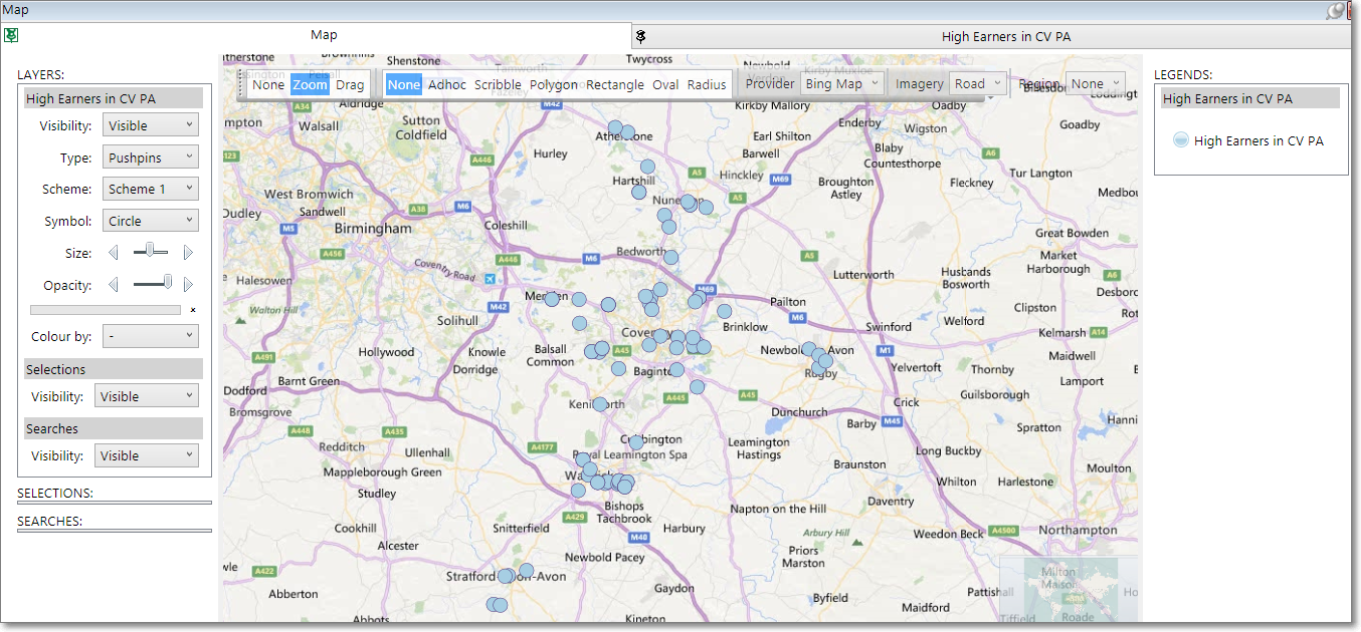
For information on viewing the map and the results - see Bing Maps: Plot Map - Viewing the Map and Bing Maps: Plot Map - Viewing the Results