Bing Maps: Shaded Maps - Adding Statistics
As well as displaying values - for example the number of People on a map - you can also generate and display a calculated statistic for those people being represented on the map.
Added in Q2 23
Whilst you can use the Add Statistics method described below, from the Q2 2023 release:
-
You can drag variables directly on to the Statistics panel on a map layer, rather than having to use the Add Statistics button.
-
A left-drag adds the statistic using the default function - eg. Sum(Cost)
-
A right-drag allows you to select from four options - Sum, Mean, Minimum, Maximum - or Add Statistics... to access all options
-
-
Changing the primary statistic on a thematic map layer automatically updates the thematic shading without the need to rebuild the map.
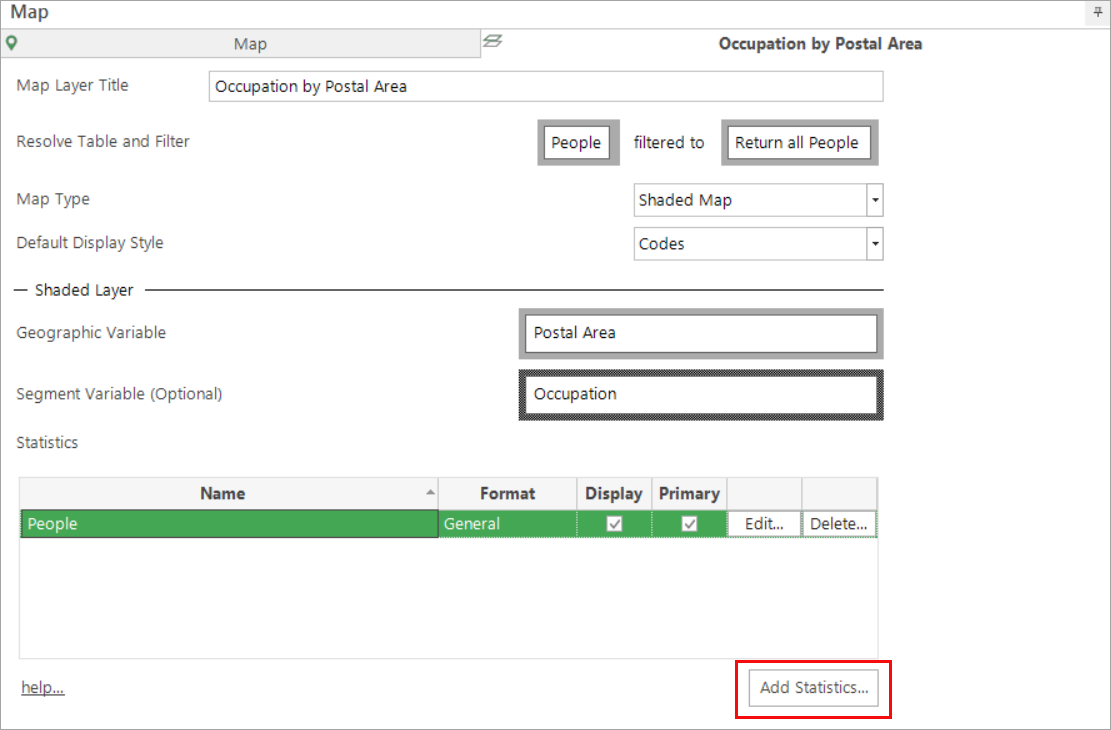
Let’s use the example of Occupations by Postal Areas created here . We can now amend this example to optionally display the total profit each of those occupations (in the specific Postal Area) has contributed to our business.
-
Click on the Layer tab (Entitled Occupations by Postal Areas)
-
Click on the Add Statistics… button to display the Statistics window
-
Click on the radio button Specify other Table, Variable or Expression
-
We can now drag on the Profit variable and select the statistic we want to apply - in this example Sum

-
Click OK
-
Within the Statistics panel change the Primary Statistic from People to Sum(Profit)

-
Click the Build button
When we move the mouse pointer over a chart, the tool tip that is displayed now shows the total profit figure per occupation for the Postal Area they live in.
