Modelling Environment: Behaviour-based Modelling - Transactional Combinations
Introduction
Behavioural Modelling helps you to focus your marketing, allowing your analysis to be based on transactional behaviour rather than, more typically, being based on demographic details. Behavioural Modelling, as the name suggests, involves studying a person’s behaviours as opposed to their characteristics. You create Behavioural Features within the Modelling Environment. A Behavioural Feature is an expression defined by the user and generated on the Dimensions tab.
The Modelling Environment also supports the creation of Combinations to classify transactions. These can then be applied as filters in other Behavioural Features. For example - a “Meal Deal” combination could be defined as a transaction containing some sandwich + some snack + some drink and this could be used as a filter, allowing you to create a feature that calculates the proportion of transactions that a person had in the last month which contained a meal deal.
A Combination involves a grouping of items; for example, a group of items in a shopping basket. In a retail environment the grouping level could then be the basket transaction. Alternatively, a web visit could be classified based on the combination of pages that were browsed.
As with the other behavioural modelling functionality, this functionality becomes available when:
-
the Analysis selection contains a date clause which is relative to today - e.g. a selection of people who will travel to America in the next month
-
the Training Date has been set - e.g. 01/01/2017
Key terminology for behaviour-based models:
Combination – a grouping of items
Training Date – the date at which you study the records to create the model
Analysis Group – a selection of people with the desired behaviour
Base Group – those you wish to compare the analysis group against to find people with the same desired behaviour
Behavioural Feature – an expression generated on the Dimensions tab to explore transactional data
Evaluation Date – the date at which you evaluate the model. You will know whether or not people exhibited the desired behaviour after this date and, as such, you can see if the model was good at spotting those with the desired behaviour, or not
Scoring Date – the date when you apply the model. Once you have found a model you are satisfied with, this date will be the date on which you apply it and use it ‘in production’. Note you also score data in order to evaluate it
PWE (Predictive Weight of Evidence) – how good something is at predicting a likely behaviour
Power – the strength of the model ranging from 0-1, with 1 being the strongest
Example
The following example uses the Communications History table of Apteco’s Holidays demo data set, together with the FastStats’ Modelling Environment where (within the Selection tab) a Training Date, an Analysis selection which looks forward, and a Base selection which looks back in time have all been defined:
-
Training Date - 01/01/2017
-
Analysis Group selection
_754x186.png)
-
Base Group selection
_928x486.png)
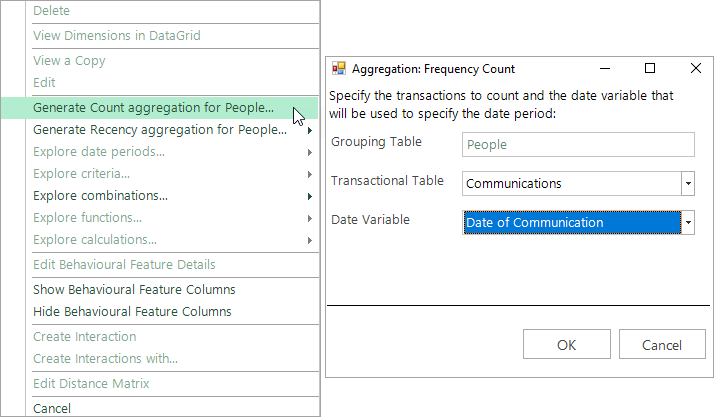
Within the Dimensions tab window, before creating any Combinations, first create simple aggregations to count communications:
1. before the Training Date
2. one year before the Training date
Note: When you first set the Training Date you are prompted to Display Behavioural Modelling Columns which are helpful for highlighting differences between any Combinations you subsequently create.
.png)
If you opt not to display these immediately, you can add them into the display later by right-clicking any of the Dimensions' column headers and selecting Column Chooser…
Having set the Training Date, right click within the blank space of the Dimensions panel and create a Dimension for Count(Communications) before Training Date:

The Dimension is displayed in the grid at the top of the window.

- Right click on your new Dimension to create the second Count(Communications) – 1 year before Training Date aggregation:
_988x371.png)
A further Dimension is added to the display.
.png)
It is now possible to start creating Combinations.
Creating Simple Combinations
To create a new Combination, right click a Dimension to access the menu options. A Combination can be created on any table which has a child table associated with it.
It may be helpful to reposition the “Table” column, as this clarifies which features are at a transactional level. Simply left-click and drag the column by its header into the required position.
.png)
In the above example, for the Response Type variable, a communication could be classified based on the Combination of responses received. You can then choose which categories are to form part of the Combination. For example, you could select all “keycoded” categories, and then define a Combination which classifies Communications which received "SOME” keycoded responses:
_516x683.png)
You can give a custom description to your set of selected categories; this is then used for any descriptions based on this Combination.
The different types of simple Combination allowed are:
NONE: None of the listed items can be in the group.
SOME: One or more of the listed items must be in the group.
EVERY: Every item listed must be in the group, with possibly other items too.
ONLY: The group must contain some item on the list and no item outside the list
EXACTLY: The group must contain every item on the list and no item outside the list
Create a new Combination from an existing one
A new Combination can also be created from an existing combination by changing the combination type. This is of particular use when you have extensive picklists and want to ensure the same categories are selected in further Combinations. For example, a second Combination could be defined to classify communications where the "ONLY" type of response was a keycoded response.
- Right click on the existing Combination and select as shown below:
_1235x537.png)
Using a Combination as a Filter
Previously, a standard behavioural feature such as “Count of Communications” could only be filtered by variables on the same transaction table. Once a Combination has been created at the appropriate level, it can be used as filter criteria in one of 2 ways.
Firstly, to apply one or more Combinations as filter criteria to a single feature:
- Highlight the required Combination
- Right click to access the menu options, as shown below
_1233x534.png)
Alternatively, to apply a single Combination to one or more features:
- Highlight the required features
- Right click to access the menu options, as shown below
_1237x597.png)
Notice that the Table column can be used to identify the level at which each feature is defined:
.png)
Creating Compound Combinations
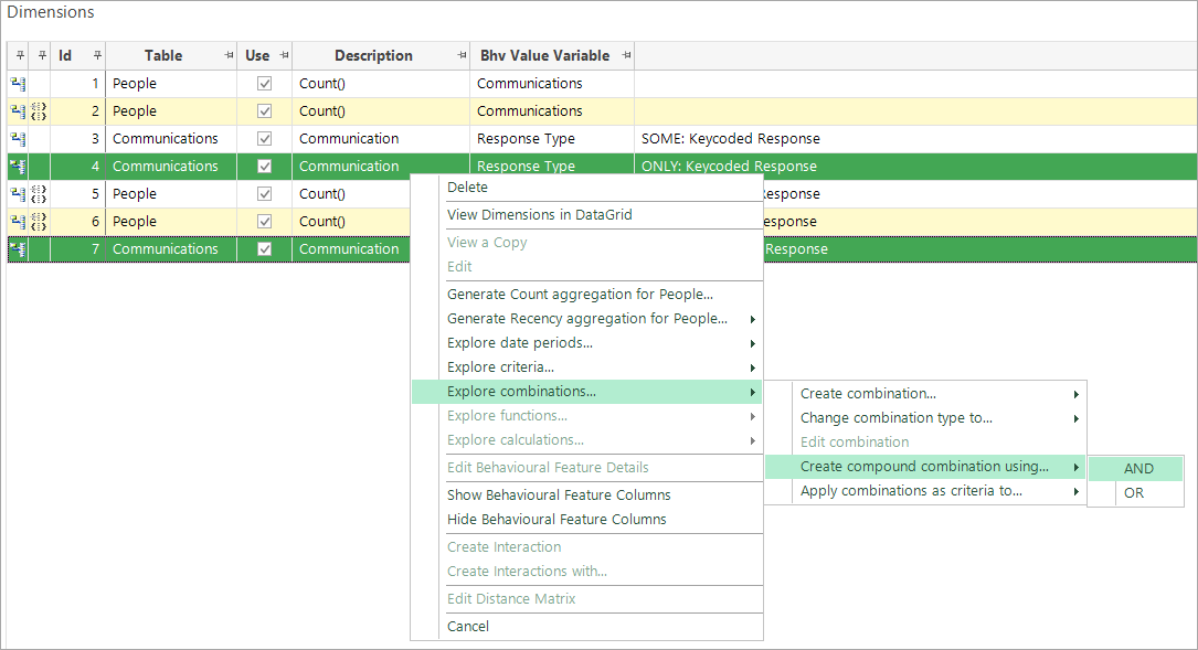
Combinations can be combined using AND or OR logic. Simply select your required Combinations and right click to navigate to the menu option, as shown below:

Combinations can only be combined in this way if they are based on categories which come from the same variable and combined to the same grouping level.
_1214x303.png)
Viewing a Copy
As with all Behavioural Features, right-clicking on a dimension to “View a Copy” shows how the Combination is defined. It may be displayed as a selection, or as an aggregated expression containing a selection:
.png)
Example Selection
_1052x394.png)
Example Aggregated Expression containing a Selection
Person Level Combinations
You can also define Combinations at the customer level, rather than the previous examples which are categorising a transaction. For example, in the Holidays system, the grouping level could be People, and the transactions' level could be Bookings. In this case, the date variable is associated with the transactional items being combined and, consequently, the selection logic has the date criteria against each part of the Combination logic. Compare this to the previous selection where the date is at the grouping Communication level.
_1458x424.png)
Let’s consider the reason for these Combination ‘time stamps’.
In the case of products, a number of product purchases could all be part of the same transaction and, as such, they share the same time stamp.
.png)
.png)
However, at a customer level, the transactions (Bookings) could have all taken place at different times and, therefore, each transaction has its own individual time stamp.
.png)
_808x256.png)
Change in proportion of communications
So far we have explored changes in counts for our Combinations, but it is also possible to explore changes in proportions of the counts between one period and the previous, as well as relative to the total for the variable used on the selected Dimension.
For example, as a proportion, you may wish to examine how many more shirts have been purchased this year compared to last - or compared to overall. This can be achieved by selecting the Dimension you wish to explore and using the right-click options:
.png)
.png)
The calculation menu options are only available when it is possible for them to be calculated
A "change" calculation is possible when you can identify the previous time period.
For example:
-
if the current dimension is for the last year, the change will be relative to the year before;
-
if the current dimension is for the last four weeks, the change will be relative to the four weeks before that.
It is not possible to calculate a change when the time frame is "sometime before", since this is open ended - i.e. nothing existed before the start of time.
A "relative to total" calculation is only possible where a criterion has been applied.
For example:
-
if the current dimension is a Count of bookings to Africa, the proportion will be relative to all bookings.
Related topics:
-
Modelling Environment: How do I create a Behaviour-based Model?
-
Modelling Environment: Behaviour-based Modelling - Event Driven Point-in-Time