Modelling Environment: How do I create a Behaviour-based Model?
Introduction
FastStats models can predict likely purchasers of a product based on the characteristics of the current purchasers. This gives you a useful tool to help focus your marketing, as your analysis can be based on transactional behaviour and not just socio-demographic details. For example, if you know who has already been to Sweden, you can use a Decision Tree, or Profile, to identify their characteristics and find ‘lookalikes’ to whom you can try and sell holidays to Sweden.
Behaviour-based modelling in the FastStats Modelling Environment develops this functionality in two very useful ways:
1. It allows you to use transactional data to a far greater extent;
2. It provides an opportunity to create the model at one point in time, evaluate it at another point in time and then, if the evaluation shows the model is effective, apply the model to the present date.
Added in Q2 21 - the ability to create detailed 'event driven', customer journey selections.
See Overview of Customer Journey Selections
Added in Q1 21 - the ability in the Profile tool to train and evaluate models on different dates is now also supported in the Decision Tree tool.
See below.
Key terminology:
Base Group – people you wish to compare the Analysis Group against.
Analysis Group – a subset of the Base Group, identifying people who have already demonstrated the desired behaviour.
Event - a step along the customer journey, identified by the occurrence of a particular transaction linked to the customer.
Event driven date - a date which can be unique to each individual, identifying the date an event occurred for them.
Training Date – the date around which you study records in order to create a model.
Evaluation Date – the date at which you evaluate the model. You will know whether or not people exhibited the desired behaviour after this date and, as such, you can determine if the model is good at spotting those with the desired behaviour, or not.
Scoring Date – the date when you apply the model. Once you have found a model you are satisfied with, this date is the date on which you create the Virtual Variable and move it 'into production’. Note you also score data in order to evaluate it.
Reference Date – the date from which all the eligible transactions are identified in the selection dialog, to inform which People are included in the analysis and base groups. It can be any of the Training, Evaluation or Scoring dates depending on the stage of the modelling process.
Point-in-Time – is defined at the bottom of the selection dialog. This date is the starting point from which behaviour is analysed and can be different for the Analysis and Base groups. e.g. Base group might use Booking Date, whilst the Analysis group might use Policy Date, meaning we would study the behaviours prior to making a booking in the Base group, but prior to taking out a policy in the Analysis group. This date is normally the event driven date.
Behavioural Feature also referred to as a Dimension - a FastStats Expression, generated on the Dimensions tab, that typically explores transactional data.
Recency - e.g. time since last...
Count - e.g. count of...
Value - e.g. cost of... change in mean...
Criteria – specific criteria that you add to Count, Recency or Value Dimensions. e.g. count of bookings made by people who have booked certain facilities.
Combination – a specific combination of transactions.
PWE (Predictive Weight of Evidence) – how predictive of behaviour each category within a dimension is.
Power – a figure, on the results tab, ranging from 0-1, used to determine which model is the most predictive. The higher the number, the more predictive power the model has.
Scenario: It is December 2019 and you want to identify people for a promotion to run in January 2020
To support a campaign that is promoting U.S. holidays, it would be useful to create a model predicting who will travel to the U.S. in the next month.
-
The Training Date could be set to, say Jan 1st 2017, to learn from people who went to the U.S. in the following month and, hopefully, identify characteristics in their preceding behaviour that they had in common.
-
The Scoring Date could then be set to, say Jan 1st 2020, to predict which people to target, by scoring them based on how closely their recent behaviour matches the characteristics (Behavioural Features) of the people in the training data.
-
Define one or more Evaluation Dates in between, to assess the success of the model.
The purpose of the Modelling Environment is to discover Behavioural Features which distinguish these groups of people, and to use these to create and evaluate models.
Likely stages in the process:
1. Create an Analysis and a Base Group and then generate Behavioural Features and identify those that are most predictive
2. Train a model – e.g. 01/01/2017
3. Evaluate the model, in the Modelling Environment, possibly on more than one date – e.g. 01/01/2018 and 01/01/2019
4. Was the evaluation successful?
If YES - go to step 5
If NO - return to step 1
5. Examine the results in the profile using the Training Date 01/01/2017 – are you happy?
If YES - go to step 6
If NO - return to step 1
6. Further evaluation of the model in the Model Report tool. Create a VV with a fixed date which you wish to evaluate as the Scoring Date – e.g. 01/01/2018 and/or 2019. Does the model make a powerful prediction?
If YES - create a VV for the date you wish to produce the model – e.g. 01/01/2020
If NO - return to step 1
Creating the selections
To use this functionality, the Analysis and Base Group selections need to use date rules based on the value of “Today”.
If the selection is run in isolation, outside of the Modelling Environment, it will use the actual date, and so may count to zero.
You want to use past behaviour (before today) to predict future behaviour (from today forward by N). As such, the Base selection should use a backward-looking date rule relative to "Today", to select people based on data that would be available at the time of the Training Date. The Analysis selection should use a forward-looking date rule relative to "Today", to select people based on what they will, or did, do after the Training Date.
An example Analysis selection:
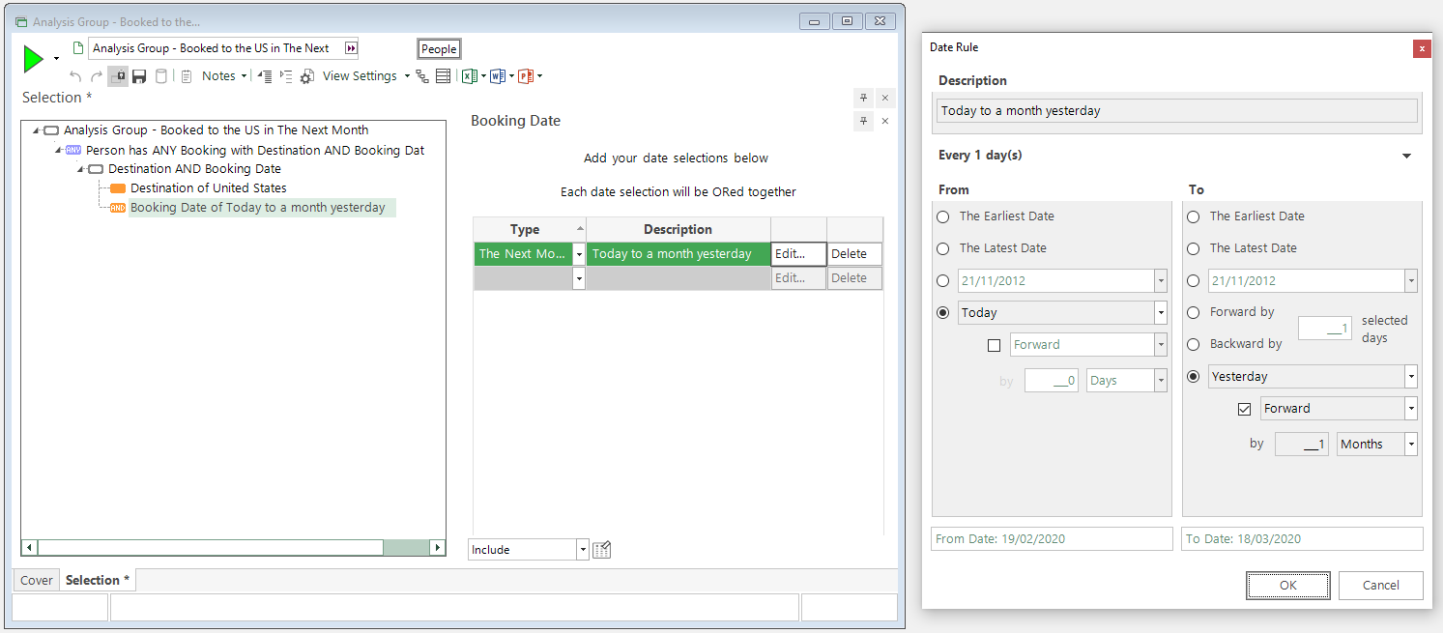
An example Base selection:
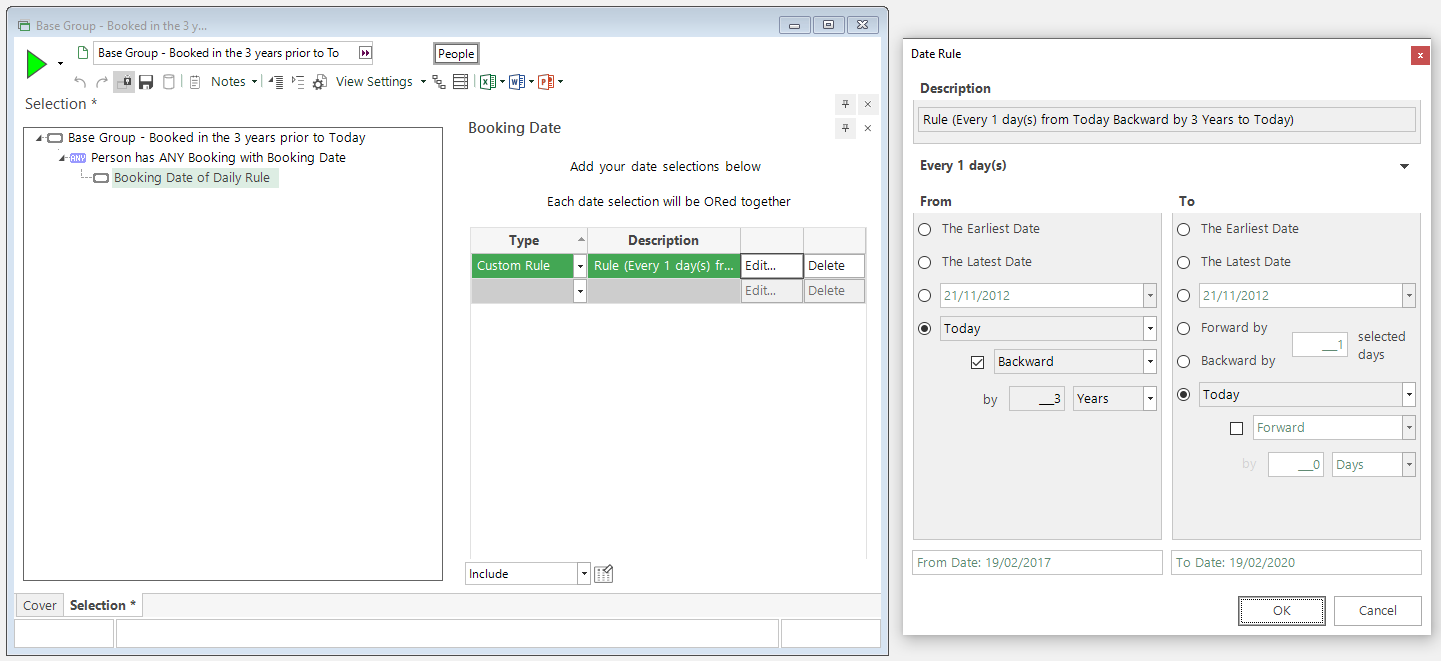
Note above that the date rule is set to go backward by 3 years in order to study recently active people. You could choose to go back to the first ever transaction, if preferred.
-
Create the above Analysis and Base Group selections
-
Open the Modelling Environment
-
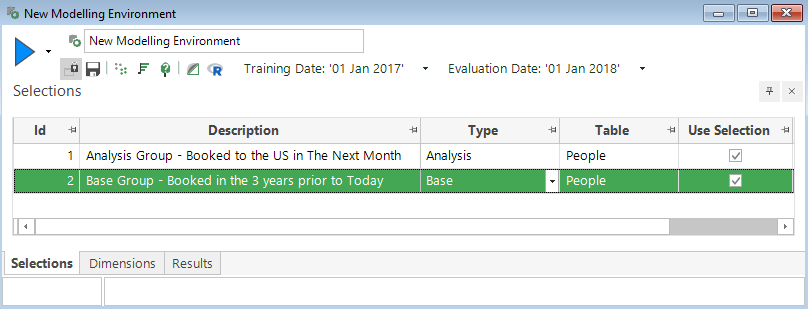
Drag the Analysis Group selection onto the Selections tab
-
Drag the Base Group selection onto the Selections tab
-
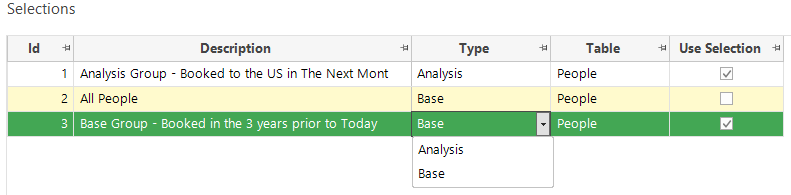
Click on the Type drop-down for your Base Group selection and change from Analysis to Base
-
Ensure the Use Selection column checkboxes are selected for the two selections you have added
-
Highlight and delete the default All People Base selection
Investigating Behavioural Features
Specify Training Date:
Firstly, you must specify the Training Date on which you want to explore the behaviour. The Training Date determines the value of Today used in both of the selections as well as in the Behavioural Features that you will go on to create in the Dimensions tab; hence it controls the transactional data used in the dimensions.
-
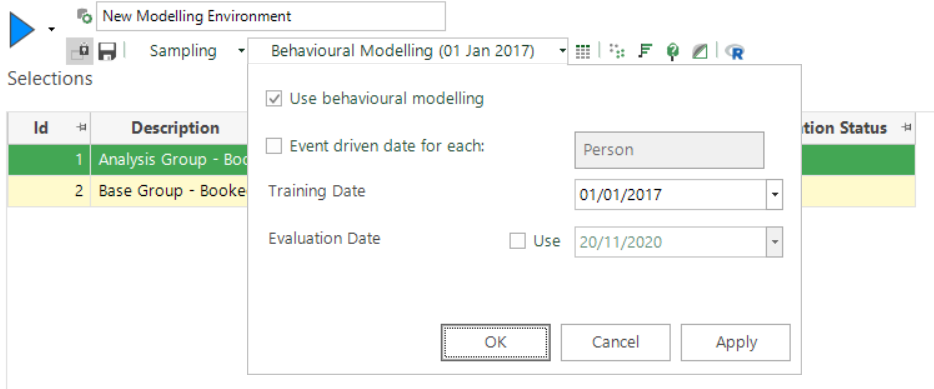
Click on Standard Modelling on the toolbar to access the dialog where settings can be applied
- Check the box to Use behavioural modelling
-
Set the Training Date to 01/01/2017
-
Apply and OK the changes
With an Analysis selection of “People booked to the U.S. in The Next Month”, and the Training Date set to 1st Jan 2017, the Modelling Environment will analyse the characteristics of people who travelled to the U.S. in Jan 2017.
With a Base selection of “People booked in the 3 years prior to Today”, the Modelling Environment will be comparing against people who were already customers in the 3 years preceding 1st Jan 2017.
Creation of Behavioural Features:
You can still use demographic details, such as Region or Newspaper, but the functionality has been extended to allow you to study Behavioural Features. A Behavioural Feature captures aspects of an individual's historic transactional behaviour with a view to identifying traits that distinguish people in the Analysis selection.
Behavioural Features can be created from any of the transactional tables below the level at which the Modelling Environment is set. With the latter being People, examples in Apteco’s Holidays data set, include:
• The number of communications received in the last 6-months
• Total spend on holidays to Europe as a proportion of all holidays
• The change in average spend on all bookings in the last year compared to the previous year
Behavioural Features are generated and explored using right-click menu options within the Dimensions tab.
-
Switch to the Dimensions tab
You can:
-
Right-click on the blank area to start a new Behavioural Feature using any transactional table and variable - e.g. Count of bookings before Training Date
Only enabled when there are transactional tables
Or:
-
Click on an existing Behavioural Feature to create other features which explore in different ways
The enabled actions include the following:
Exploring the date period
e.g. To only analyse transactions that are… 1 month before the Training Date / Between 4 and 6 months before the Training Date
Explore filters based on selector variables
e.g. Frequency of bookings to Australia
Explore different functions of numeric variables
e.g. Total spend on US Holidays
Combine filters
e.g. Create feature such as Total Spend on US or EU Holidays by selecting and combining the individual US and EU based features
Relative to Total for a selector variable
e.g. Proportion for U.S. of total spend
Change in value from previous date period
e.g. Change in total spend between 1 year before and the previous
Added in Q4 21 - two new Behavioural Features
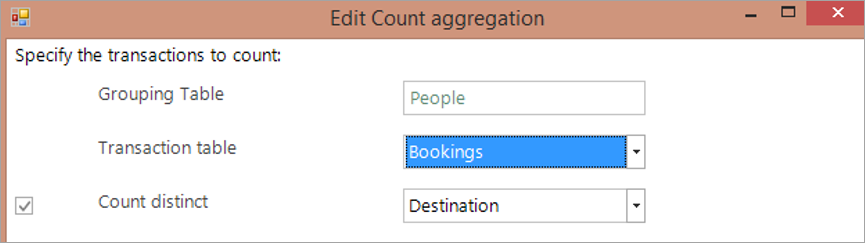
The number of distinct categories that a customer has transacted with can be a good measure of a person's engagement with your business. You can use any selector variable from the transaction table in a behavioural model to identify people who, in addition to demonstrating high frequency, also show a broad repertoire and wide engagement through their transactions.
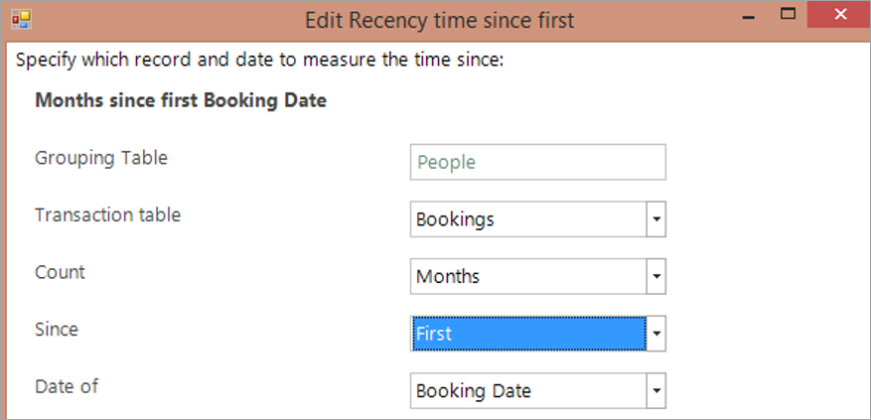
You can measure a person's length of relationship with your business. The time can be measured in a choice of units and an appropriate banding is applied. By default, all historic options are considered, but you can use a time frame to limit the range of transactions to find and, for example, examine the time since first booking in the last 3 years.
Each action creates one or more new features which are added to the Dimensions tab.
Let’s add a few Behavioural Features:
-
Click on the Dimensions tab
-
Right click within the Dimensions area
-
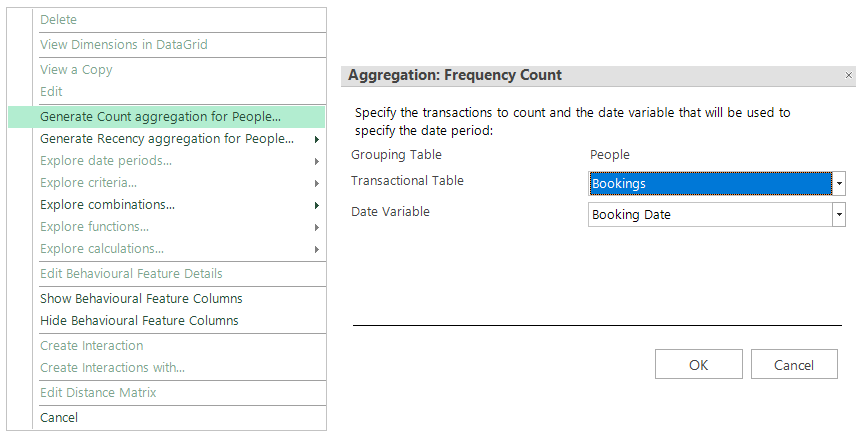
Mouse over Generate Count aggregation for People…
In the Aggregation: Frequency Count dialog
-
Set the Transactional Table to Bookings
-
Set the Date Variable to Booking Date
You now have a Behavioural Feature studying Bookings made before the Training Date by those in the Base selection.
-
Right click on the Count (Bookings - Before Training Date) row
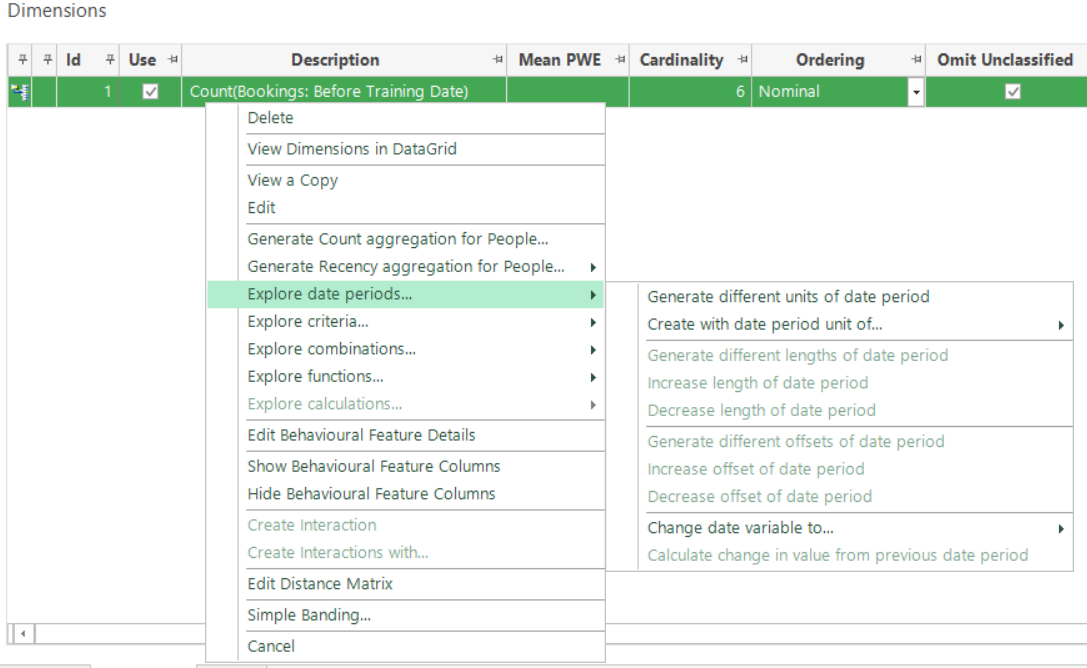
You can now select how to explore that Behavioural Feature using the given Explore…options.
-
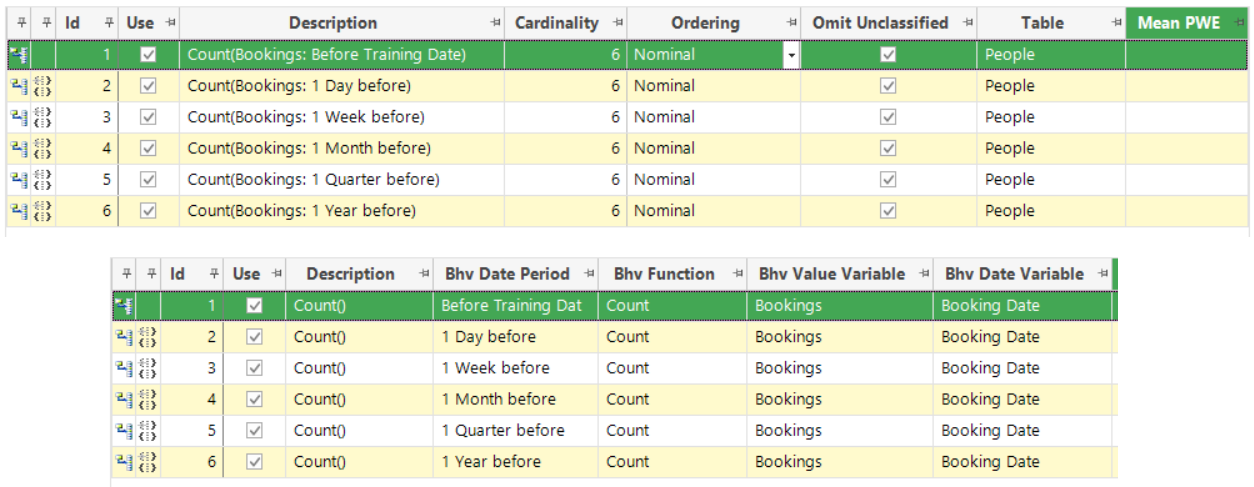
Mouse over Explore date periods…
-
Click Generate different units of date period
In some situations, you may want to remove the Features from which the new ones were created. When appropriate you will be presented with this dialogue giving you the ability to decide how to handle the original Features:
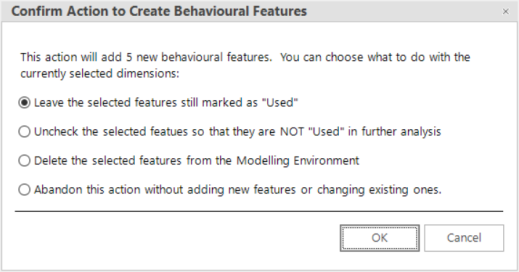
-
Click OK
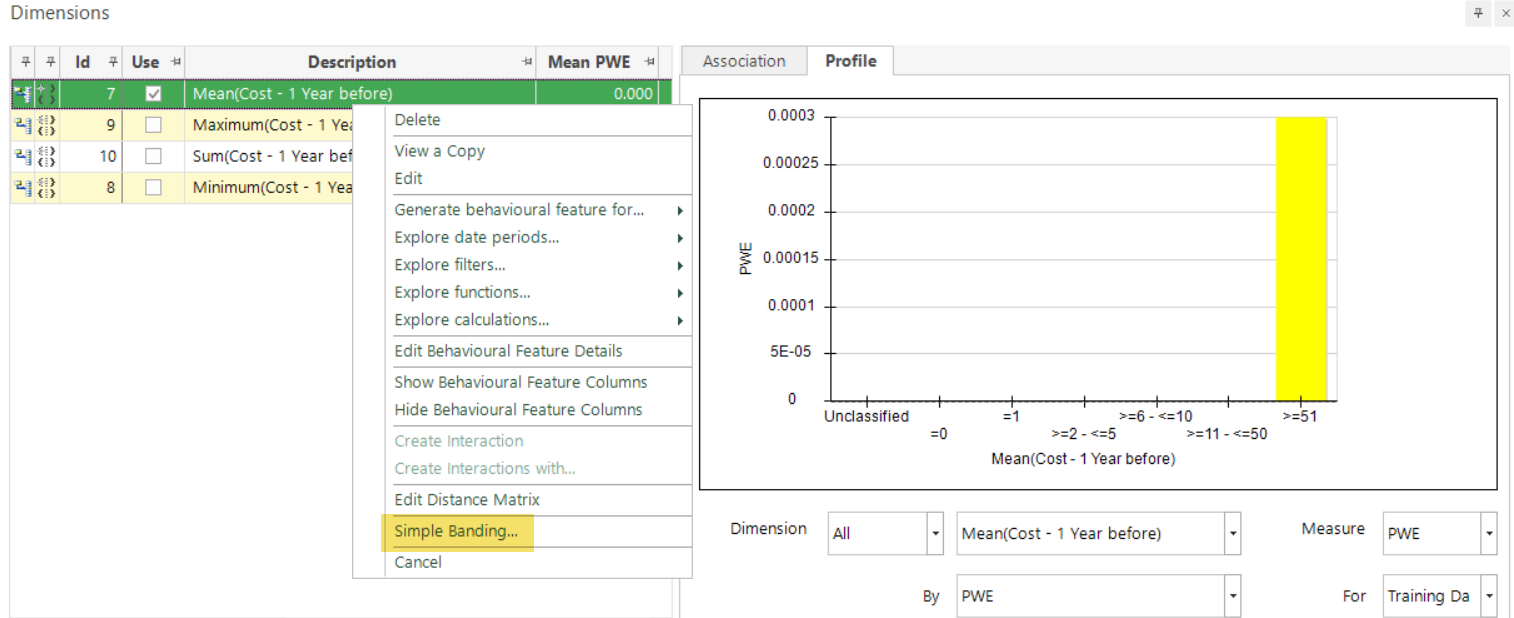
Note, when exploring a numeric function, e.g. Booking Cost, the default bandings may not be appropriate. If this is the case, simply right click on the Behavioural Feature, select Simple Banding and define the bandings you require.
Behavioural modelling also supports the creation of RECENCY features as an alternative to count and value aggregations.
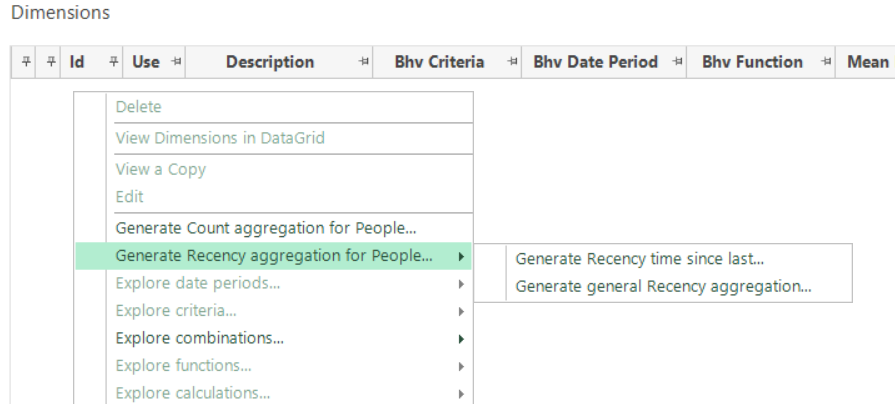
The “...time since last...” feature allows you to create a banded expression which is effectively a DateDiff between the latest transaction and the Training Date (or Evaluation Date).
The “...general Recency...” feature allows you to pick the value of any numeric variable based on an ordering by date.
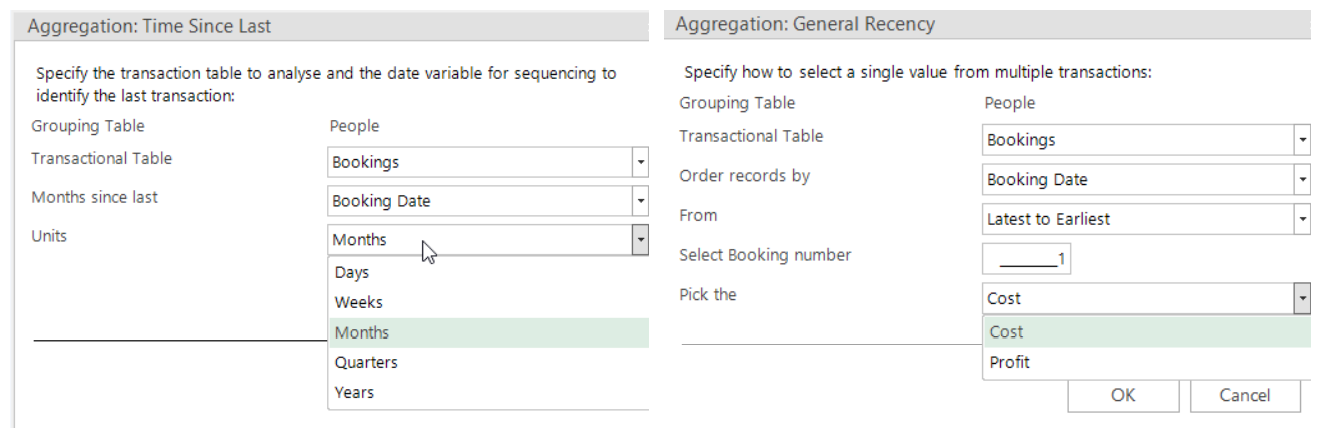
The features created support “Explore criteria...” so that you could, for example, generate features for “Months since last Australian booking".
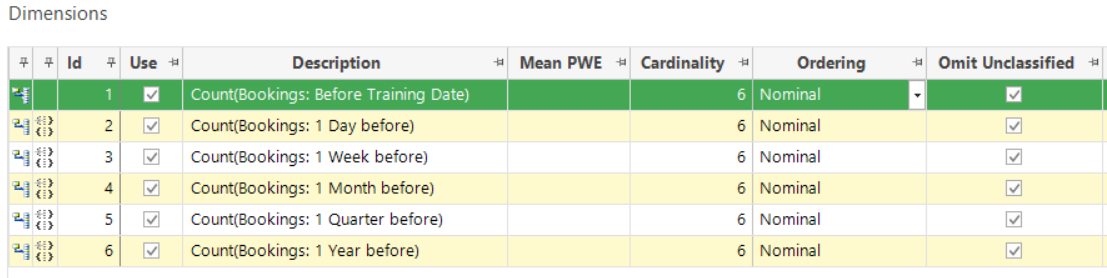
Handling of multiple Behavioural Features:
The process is very exploratory in nature and, as such, you may create many Behavioural Features in your Modelling Environment. There are a number of additional columns available on a right-click, once a Training Date has been specified. These can be used to group and sort the various Features. Notice that the Descriptions dynamically update to be less verbose, once these columns are visible – for example, as the second screenshot below demonstrates, removing the date period from each description:
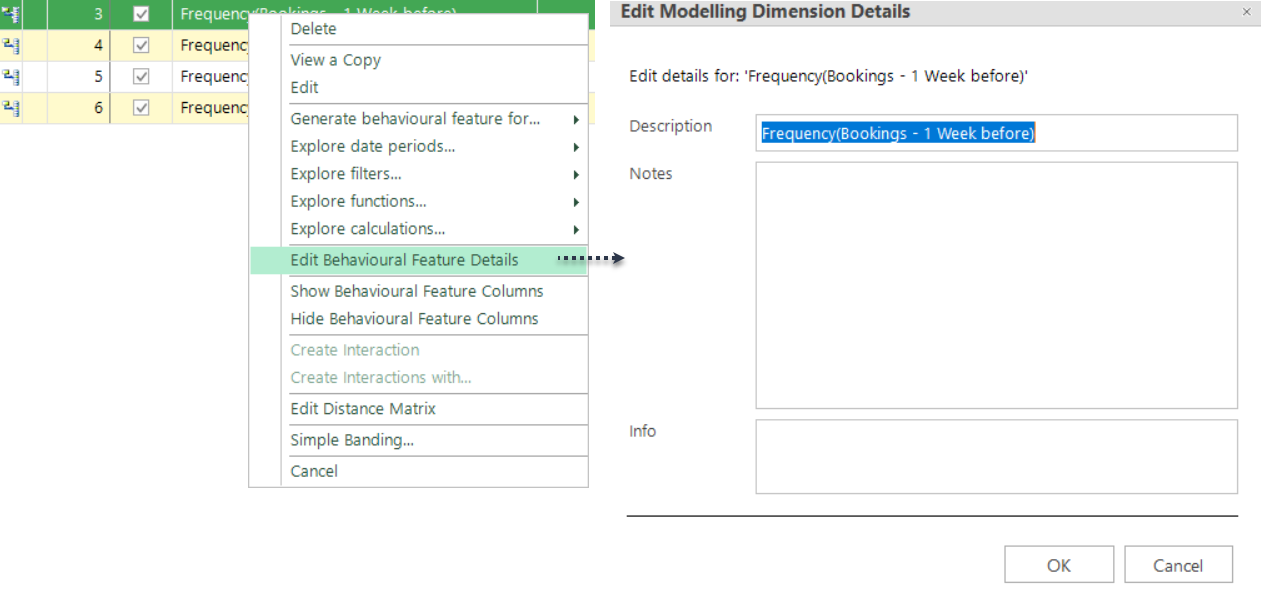
It is also possible to enter a custom description for Features using the right-click Edit Behavioural Feature Details”.
You can also train and evaluate models on different dates using the Decision Tree tool.
Setting one historic Training Date for your model, and then applying the model to a different Scoring Date, allows you to better understand and evaluate the success of the model. The scoring date could be a current date to score people ready to make a targeted selection, or it could be an interim historic date so that the model can be evaluated.
You set the Training Date within the Decision Tree tool:

You determine the Scoring Date during the wizard process used to create the score variable:

Added in Q3 21 - the ability to use the current date as the Scoring Date.
The ultimate aim of Behavioural Modelling is to create a model score virtual variable that takes the learning that has been obtained from the training process and applies it to recent data. This scoring process identifies people who are exhibiting the same behavioural patterns by giving them a high score, often with the intention of you then using these people as the target audience for a campaign.
The Scoring Date allows you to specify which data should be used in the scoring process. Previously this had to be a fixed date which was specified in the Wizard and recorded permanently with the virtual variable. Consequently, even if the variable was later refreshed, it would only score people based on their behaviour up to the fixed date recorded.
From the Q3 21 release, you can specify that the Scoring Date should be taken dynamically from the run date when the virtual variable is refreshed. This means that you can create a single score variable, refresh it periodically and, on each refresh, a customer’s latest behaviour is evaluated.
For more information on this, together with details of usability enhancements introduced in this release, see Behaviour-based Modelling - an example scenario
Evaluation of Behavioural Features
The purpose of the Dimensions tab is to identify a short-list of Behavioural Features which best distinguish the target Analysis selection. You should use the tab to explore Behavioural Features and identify the most predictive ones. Once those Behavioural Features are identified, you can then create and evaluate the models.
-
Click the Build button on the Dimensions tab
On the Profile tab, you are now presented with visualisations showing how predictive each Behavioural Feature is. The Profile chart presents statistics in a way that will be familiar to existing Profile users, with drop-down options to select and view the results in different ways. PWE is particularly useful in this instance.
-
Change the Measure to PWE
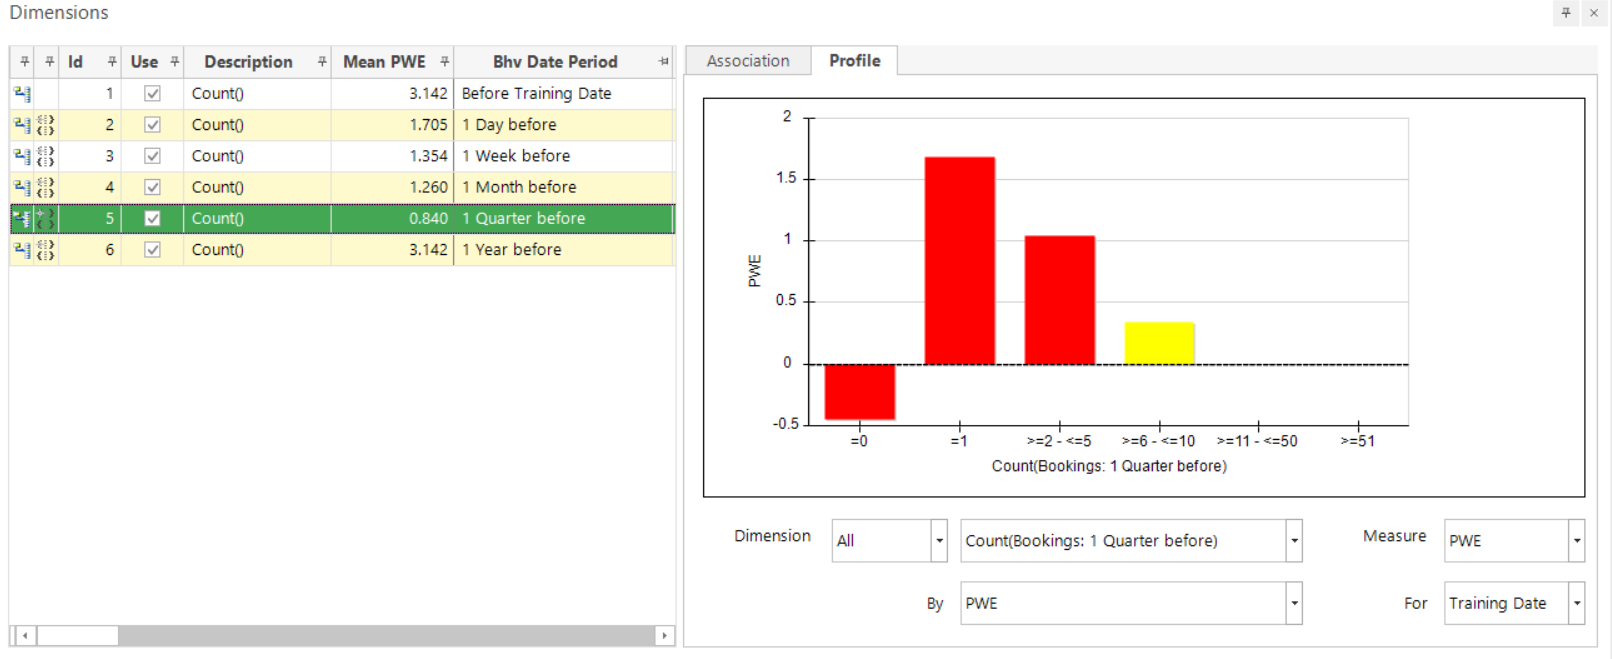
The PWE in the chart shows us how predictive each range is within each Feature. The significance level is indicated by shades of red to yellow in the same way that the Profile tool does. This example suggests that people who are about to travel to the U.S. typically only have 1 previous booking in the quarter before and are unlikely to have had no bookings in the quarter before. Those with 6-10 bookings may have a positive PWE, but the yellow bar indicates that there is actually insufficient data from which you can draw satisfactory conclusions.
The mean PWE column gives an indication of the predictive strength of each Feature (based simply on the single Training Date).
-
Click on the Mean PWE column header to Sort Ascending
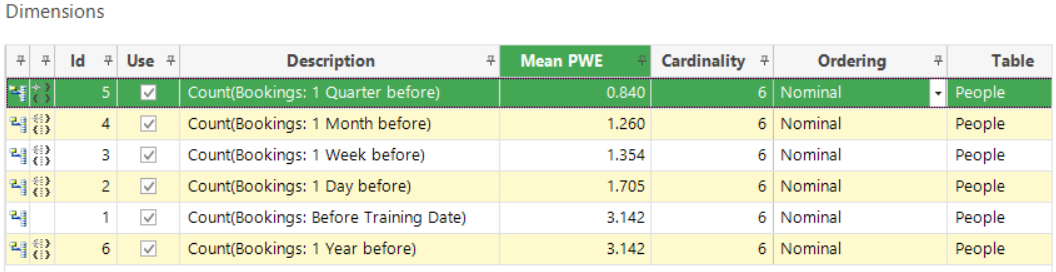
In this case you can see that 1 Quarter before has the least predictive strength overall, from which you might infer that you should continue and look at the periods with a higher Mean PWE.
Keep exploring by right-clicking rows and choosing some of the other Explore… options.
Testing the learning
Even though a Feature may appear significant based on the Training Date, any learning should be tested on a different time period. Setting an Evaluation Date, and re-running the analysis, results in the display of a Power column.
-
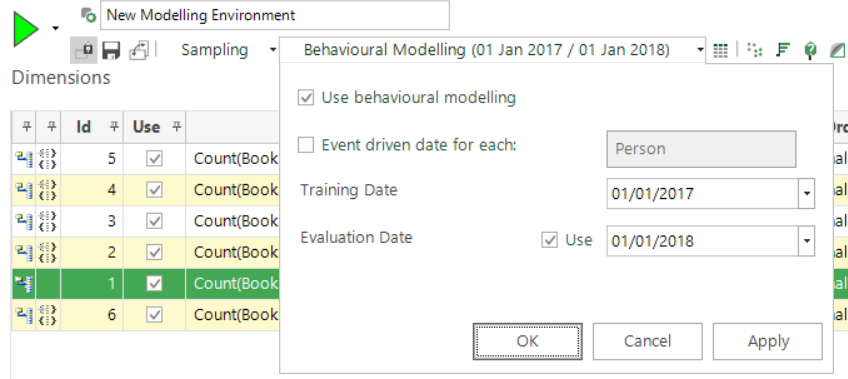
Click back into the Behavioural Modelling dialog via the toolbar
-
For the Evaluation Date check Use and enter the date as 01/01/2018
-
Click Apply and OK and then Build
-
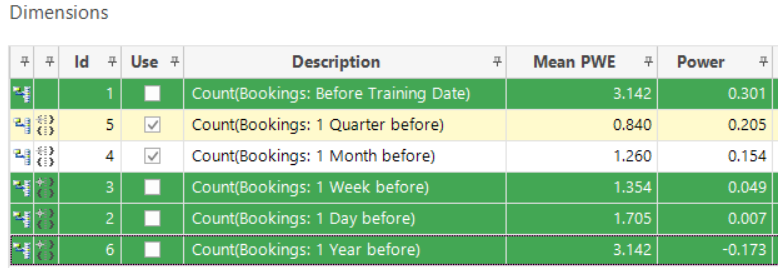
Click twice on the Power column header to Sort Descending
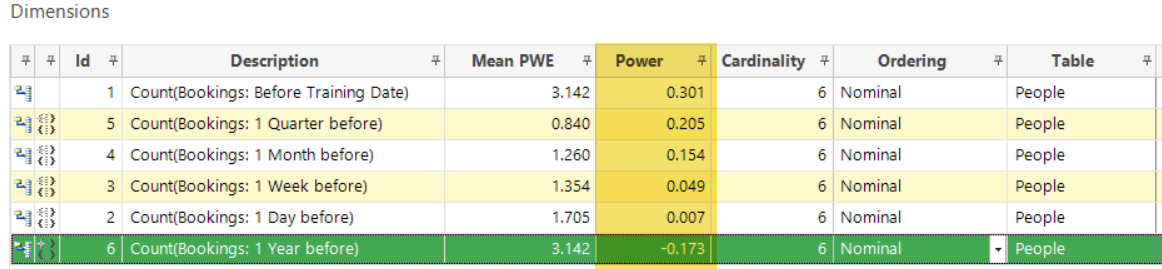
The Power gives an indication of how transferable the learnings based on the training period would be in predicting who will travel in the month subsequent to the Evaluation Date. The values range from 0 to 1 (best) and are equivalent to the Power calculation used by the Model Report - calculated for each dimension as though it were the only variable in the model.
Based on an Evaluation Date of 01/01/2018, the results in the screenshot above demonstrate that:
-
Count(Bookings: 1 Year before) appear to work well as a predictor in 2017 (Mean PWE 3.142) but are not transferable to 2018 (Power -0.173)
And in fact:
-
Frequency(Bookings: 1 Quarter before) are a more reliable indicator (Mean PWE 0.840 and Power 0.205)
In this case, because the Power values are generally quite low, you might choose to reject these initial results and instead continue to explore using different periods, filters and functions. The steps above can be used iteratively to identify the most predictive Behavioural Features and you can select the best of these in the “Use” column so that they are automatically transferred to the Profile which is launched and created from the toolbar.

Profile and PWE models using Training and Scoring Dates
Having evaluated Behavioural Features and established the best ones to use, as well as the best date on which to train the model, you can then move to the Profile tool.
Specify the Training Date when creating a Profile Model:
The Training Date determines the value of “Today” used in expressions and selections when creating the Profile and controls which time period of transactional data the model is built on.
e.g. With the Training Date set 01/01/2017 and an Analysis selection of “People booked to the US in The Next Month”, the Profile will analyse the characteristics of people who travelled to the U.S. in January 2017
e.g. With a Base selection of “People booked in the 3 years prior to Today”, the Analysis group will be compared against people who were customers in the three years before 01/01/2017
Ensure you have the desired Behavioural Features and Training Date selected in the Modelling Environment. In this example, you might:
-
deselect the ‘1 Day’, ‘1 Week’ and ‘1 Year before’ options as a result of their low Power value
-
deselect the ‘Before Training Date’ option as, in spite of it having one of the highest powers, the fact that someone has transacted at some point previously may not to be an appropriate indicator that they will do so again
-
Click the
 Profile button on the toolbar – the Profile will open in a new window
 -
Build the Profile
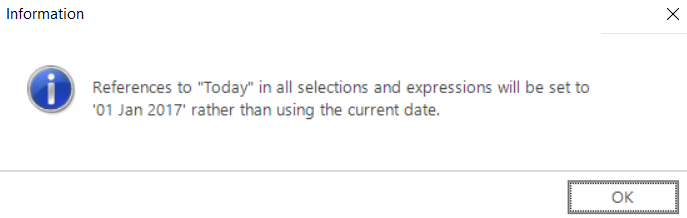
An information box confirms the “Today” reference that will be used:
-
Click OK to confirm
-
Study the Profile to ensure that you are happy with the learning
Creating a PWE Virtual Variable to score records and evaluate the models
Now you need to create a selector type virtual variable to apply the Profile model to the records you wish to score, on the date you wish to score/evaluate them. You will create at least one, but as part of your investigations, possibly 2 or more virtual variables:
-
One on a Test/Evaluation Date which you can use to further study/evaluate in the Model Report tool
And, if you are happy with the findings in the Model Report tool:
-
Another, on the date you wish to apply the model to the records you will market to
The Scoring Date sets the value of “Today” used when rolling out the Profile to create a PWE score virtual variable. This determines the date range for transactions used when assessing the behaviour of individuals being scored. Note that the values of the scores given are determined by the data associated with the Training Date used to create the model. In the Profile window:
-
Click the
 Create Profile Model icon
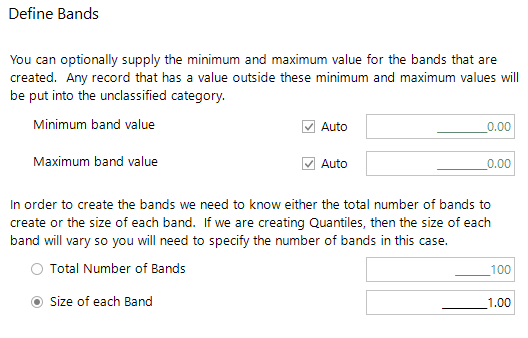
Follow and complete the wizard steps, as required – for example:
-
Banding Type - select Equal Ranges
-
Bands - select Size of each Band 1.00
-
Settings - enter your Use fixed date e.g. 01/01/2018 - to set the date on which you wish to score your records
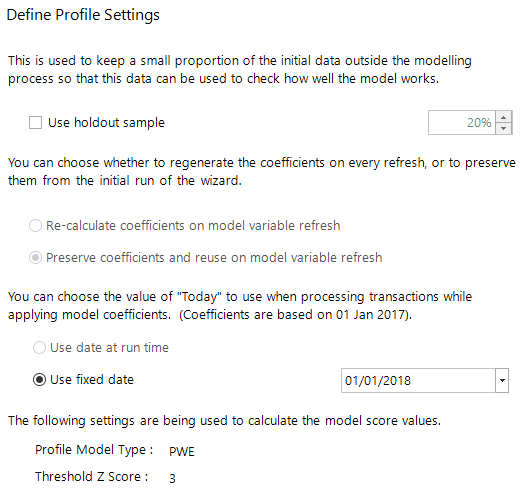
Here, a Scoring Date of 1st January 2018 scores individuals based on their behaviour up to this point in time. As you already know what they did after that Scoring Date, you can use the same date to evaluate if you have successfully predicted people who are likely to go on holiday to the US in the next month.
-
Complete the Wizard steps, naming and saving the new virtual variable into your chosen System folder
An information pop-up displays:
- Click OK
Once complete, the Finish step displays, and the variable appears in the System explorer.
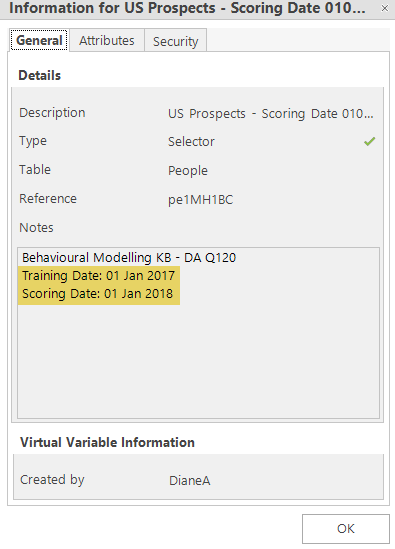
Note that the Training and Scoring Dates are visible in the Virtual Variable’s Properties which you can access by right-clicking on the Virtual Variable within your System explorer window.
Your Profile model can be evaluated using the Model Report tool. If reliable, a second PWE score variable should be created with the Scoring Date set to the date on which you want to apply the model.
Evaluating the model
-
Return to the Modelling Environment window and select the Results tab
You can evaluate models which have been launched from the Modelling Environment. Each time you build your Profile model, a new row will appear in the Results tab. When a PWE virtual variable is created, this is also displayed here.
-
Set the Evaluation Date to 01/01/2018
-
Uncheck Use Model for the Profile row (failure to do this results in the system generating a new virtual variable using default settings)
-
Click Build to calculate the Power of the model

Power ranges from 0-1 (best) and the higher the power the more predictive the model is.
Be aware, if the power is very close to 1, to check that you have not inadvertently introduced bias into your model. In the example above, the power is quite low and suggests that the model is not particularly successful when scored and evaluated on 01/01/2018.
It would be sensible to explore the results further using the Model Report tool.
Evaluating a model in the Model Report tool
The Evaluation Date can be specified in the Model Report when evaluating a model that has used the Training and Scoring Date functionality. For example, a model being evaluated may have been created using a Training Date of 2018, and then rolled out for evaluation using a Scoring Date of 2019. This would then typically be evaluated with an Evaluation Date of 2019. If the model proves useful, it would be rolled out for production with a 2020 Scoring Date.
In the Modelling Environment:
-
Click the
 Create Model Report icon
The Model Report window opens. Here you can access all the functionality of the tool but, in this example:
-
Click the Response Chart tab and Build
An information box confirms your “Today” reference:
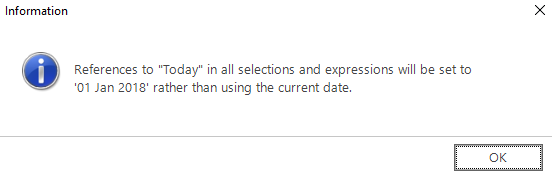
-
Click OK
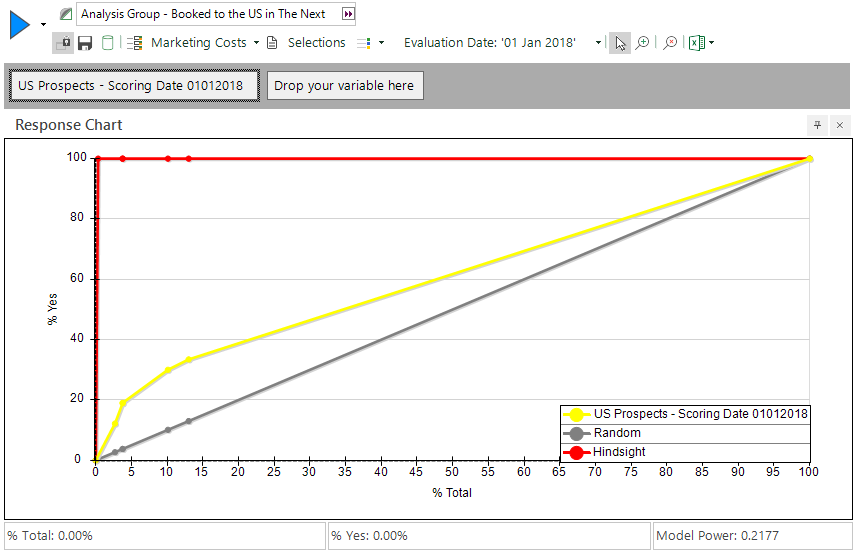
The yellow line in the above Response Chart indicates that the model is not very predictive overall. However, the model makes a lot of gains initially so, rather than selecting based on the whole model, you might choose to use the model only for those records with the very highest PWE. By selecting the 4th node, you could market to 10.11% of your database and find over 30% of those you are looking for.
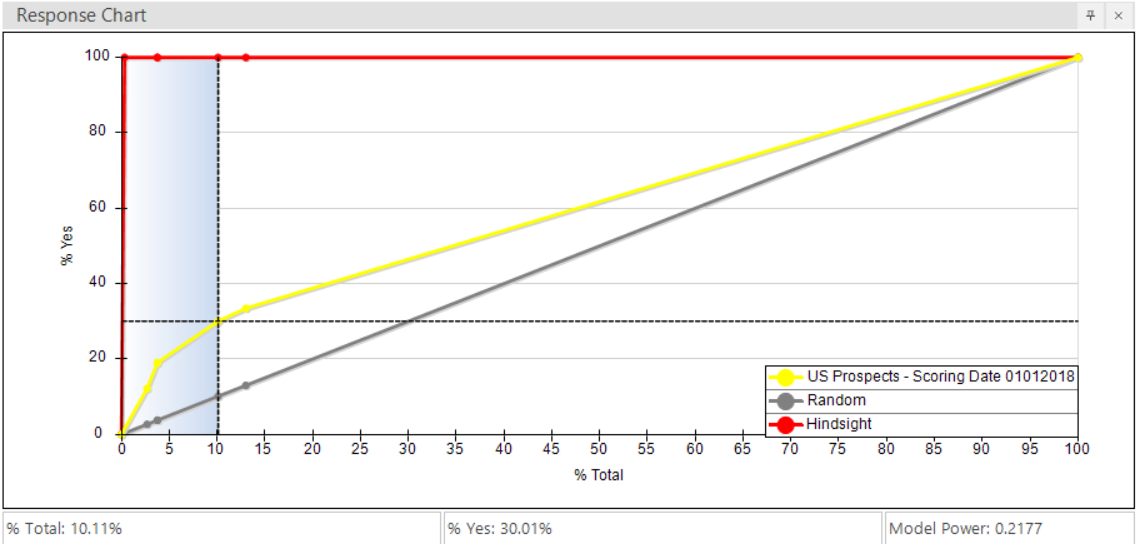
The Gains Table shows us if you only used the top PWE ranges you would be over 2.97 times more likely to find people who would book to the US in the next month than if you picked at random. So, whilst overall the model may not be powerful, parts of it are still very useful.
…and finally:
If you are happy with the evaluation, re-create the virtual variable with the Scoring Date on which you wish to identify the records for your marketing:
-
Return to the Profile window
-
Click the
Create Profile Model icon -
Set the Fixed (scoring) Date to the date you wish to put the model into production
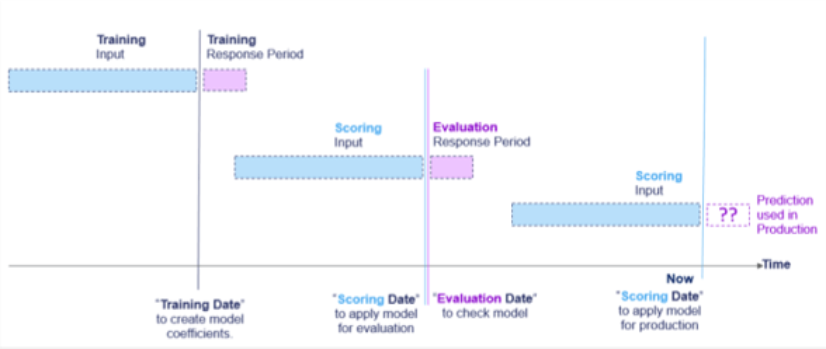
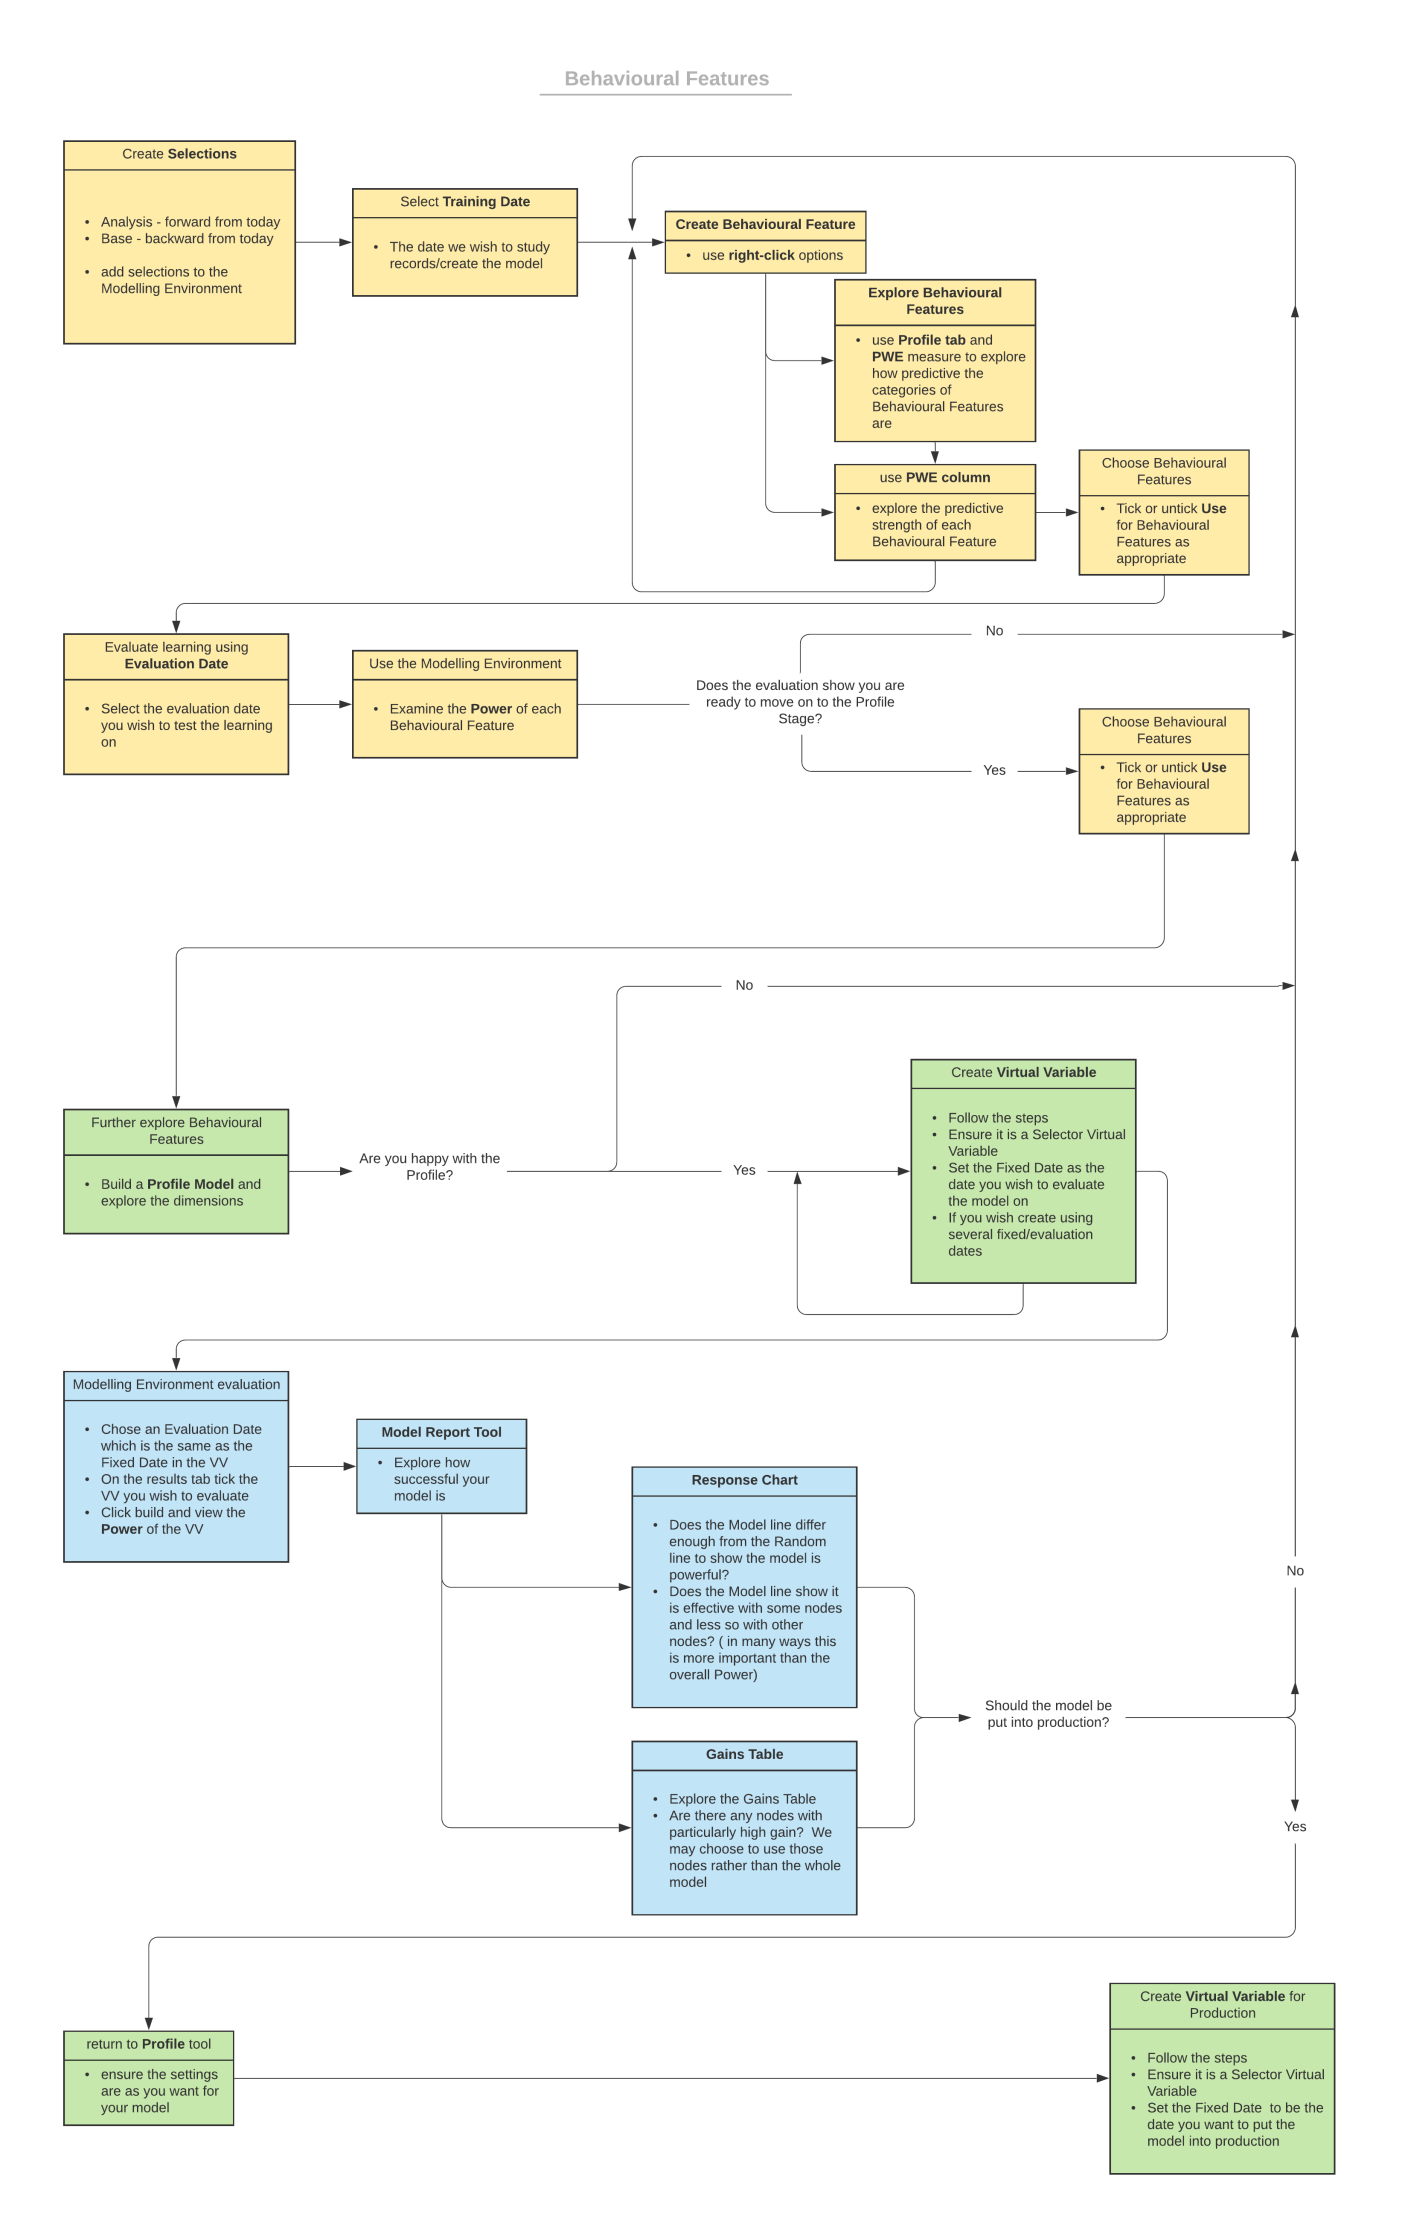
The following diagram provides a visual representation of the process for creating Behaviour-based Models:
Related topics:
-
Modelling Environment: Behaviour-based Modelling - Transactional Combinations
-
Modelling Environment: Behaviour-based Modelling - Event Driven Point-in-Time