Migration (All points)
Having created and added your segment selections, and defined your Fixed Time Reporting Points, you can run the Migration (All points) reports to examine the differences between the adjacent pairs you can see in the Time Report. In this example there are 5 time points and 4 adjacent pairs.
-
Click on the Migration (All points) tab and then click the Build button
Volume Migrations - all
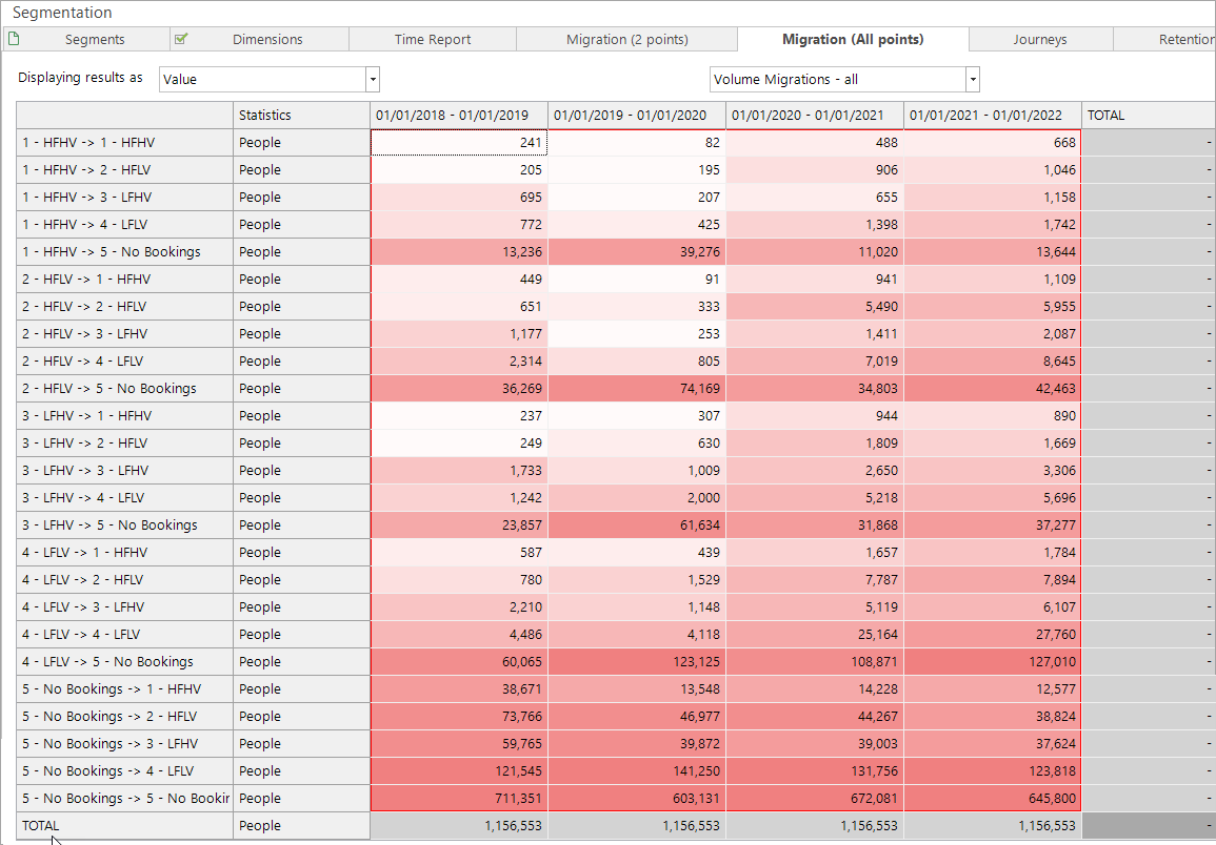
The default report is the most detailed and displays all segment migrations between all your defined reporting points:

In the above screen shot, looking at the 4th row down 1 – HFHV -> 4 – LFLV, you could say this shows the movement from your best customer group to your worst customer group. Between 01/01/2018 and 01/01/2019, 772 people made this move, 425 and 1,398 in the following periods and then 1,742 in the last.
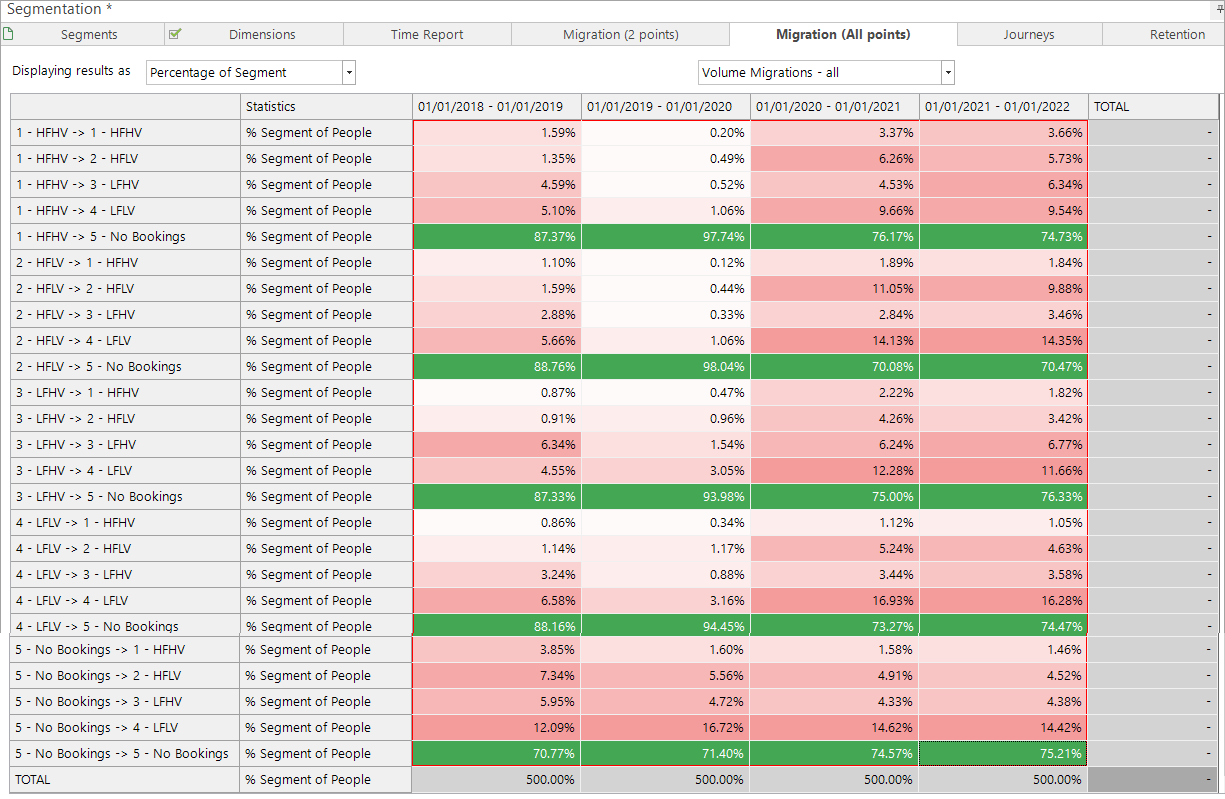
In this example it looks like there are high movements between these groups but you might get a clearer picture by changing the display to show Percentage of Segment:

You can now see the same trend in the proportion of people in the HFHV group in each period moving to the LFLV group.
The more troubling figures in this example are the migrations to the No Bookings segment:

The highlighted rows in the above screen shot show a very high percentage of customers in each segment not making a booking in that year. This would indicate our organisation has a serious issue with customer retention.
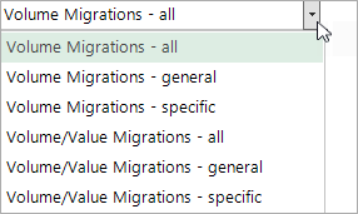
You can also create the following views of the Migrations (All points) report:

For more information on these options see Migration (2 points)
See also: