How do I explore a segmentation change over time using relative time points?
The FastStats Segmentation tool allows you to examine the breakdown of your customers (donors, subscribers, event attendees etc) into different segments based on their transactional behaviour, and then examine and track how membership of those segments has changed over time. This includes:
-
Movements between segments
-
Journeys between segments over extended periods of time
-
Calculating how long people have been in different segments
You can automate and update insight by setting fixed time reporting points in conjunction with a date rule schedule, such as the first of each month for the last year and, as with all FastStats tools, you can drag any cell(s) of interest off to create a selection for further analysis, or use the Segmentation wizard to generate segmentation virtual variables.
By identifying, for example, new customers, your best customers, those who have lapsed, or are at risk of lapsing, you can then use this insight to inform your marketing decisions.
Added in Q4 2024 - reporting based on relative time points
The ability to define 'Relative Time Points' as the points to report on allows for all of the above automation and insight, but additionally brings the benefit that any drag-off selections (or virtual variables created this way) will refer to the defined relative point and can, therefore, be used in recurring action campaigns without the need for regular or repeated user intervention.
For example, you might define your relative time point as the start of this month to create audiences for:
-
A monthly communication to the people in your best segment using a Time Report drag-off.
-
A regular special offer campaign to people who have remained in the best segment for the last 2 years using a Retention report drag-off.
-
A regular re-engagement campaign aimed at those who have lapsed in the last month using a Migration report drag-off.
Scenario
Let's take a look at that last example in practice and identify those people who have lapsed in the last month, ready for their inclusion in a monthly re-engagement campaign.
To get started:
-
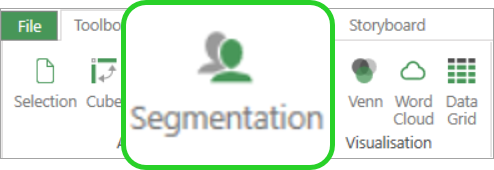
Open a new Segmentation from the FastStats toolbox.
-
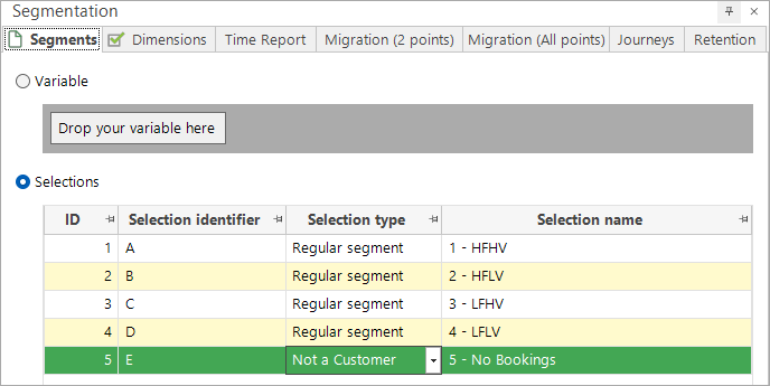
Drag and drop the segmentation selections onto the Segments tab.
See How do I explore a segmentation change over time using fixed time points? for details of how to create the segmentation selections used here.
-
Leave selections 1-4 as Regular segments but set selection 5 to Not a Customer.
-
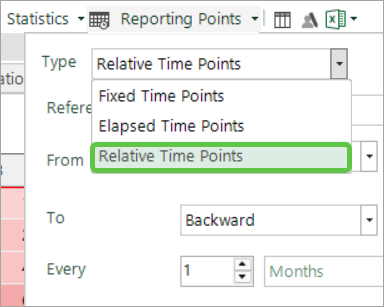
Open the Reporting Points dialogue and from the Type drop-down select Relative Time Points.
-
Use the options to define this month start of backward by 6 months, reporting monthly - as per the screenshot below:
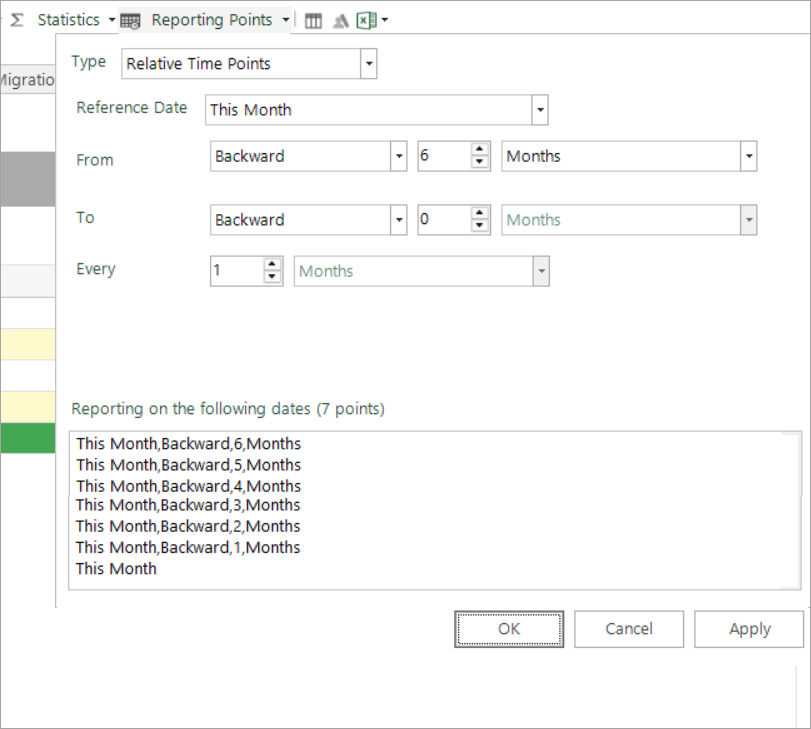
As you can see, this results in 7 points being identified - from this month backward by 6 months and forward to the start of this month.
-
Apply the settings and OK.
-
Switch to the Migration (2 points) tab and build.

The focus here is specifically on people who have lapsed in the last month, and to select those records you can either:
-
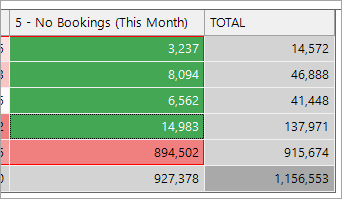
Highlight and drag the relevant cells from the current display - Volume Migrations - all:
Or:
-
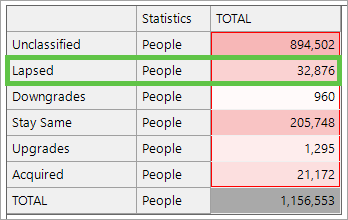
Switch the display to - Volume Migrations - general:
-
Highlight and drag the lapsed customers onto your workspace to create the selection.
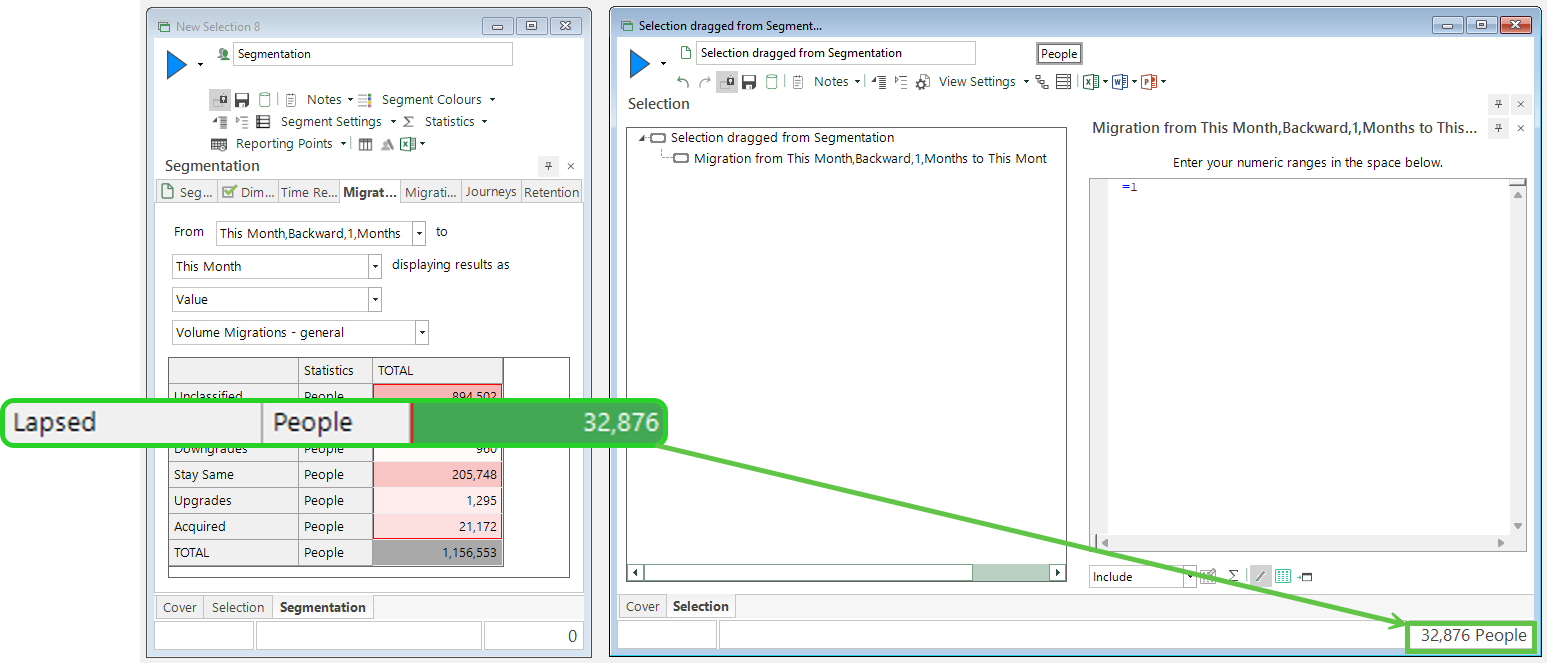
Based on today's date being 31/10/24, customers who have lapsed in the last month are identified - i.e. between the 1st September and 1st October 2024.
This selection could now be used as an audience in a campaign, scheduled each month, and intended to reactivate recently lapsed people. Significantly, you do not need to rebuild the segmentation and reselect the audience each time the campaign is due to run - using relative time points means that records satisfying the defined settings will be updated over time when used.
Relative time points are supported in all of the segmentation reports.
Return to Segmentation: Overview