Sequence Analysis: Selector variable only
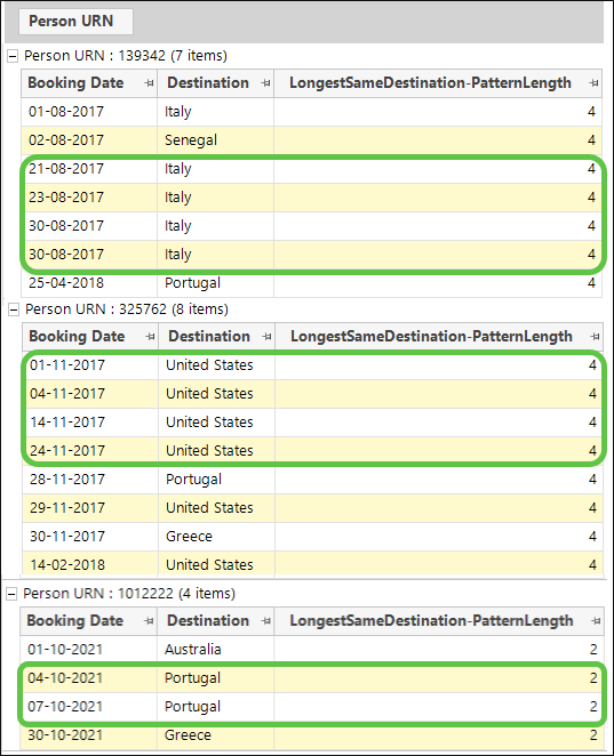
Scenario: Find the longest sequence of holidays a person has made to the same destination.
To get started, launch the Sequence Analysis wizard, then:
-
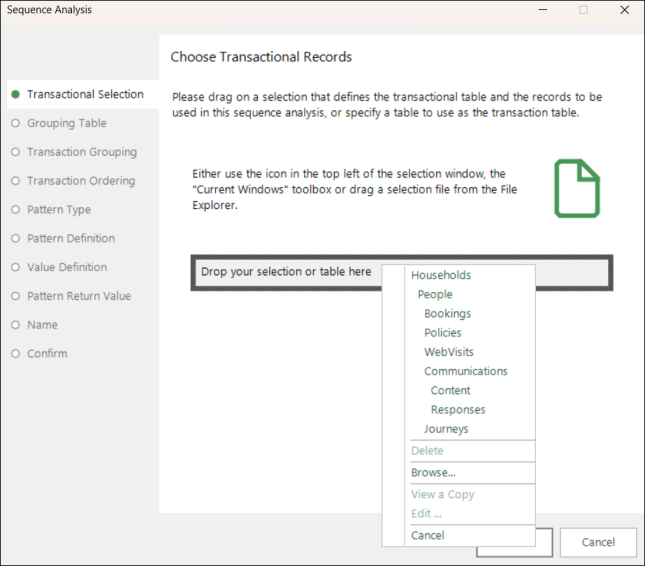
Transactional Selection - right click and select the Bookings table as the transactional records to analyse.
-
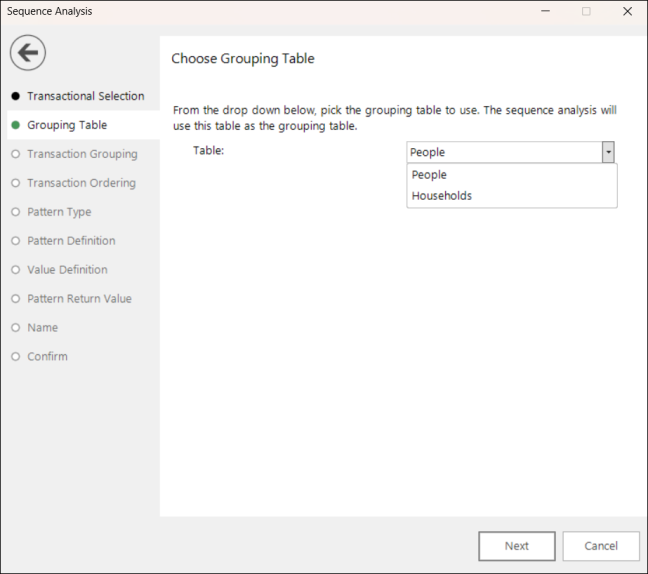
Grouping Table - set People as the table to group the bookings up to.
-
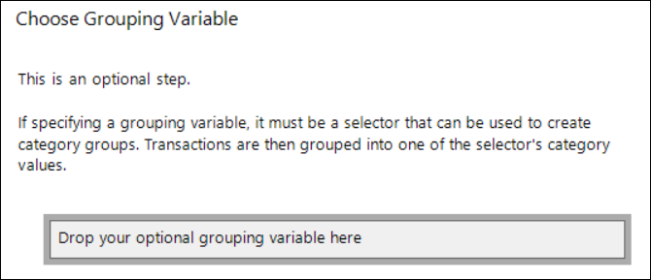
Transaction Grouping - this is an optional step that allows additional grouping into the categories of an identified selector variable. No grouping variable is required here - simply click Next.
-
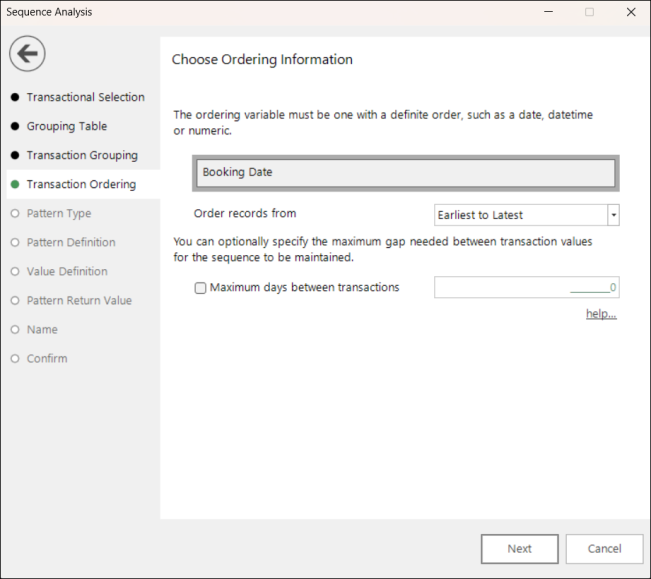
Transaction Ordering - in this example:
-
Drag and drop the Booking Date variable onto the drop-box.
-
Leave the default order as Earliest to Latest.
No maximum gap between transactions is necessary here - click Next.
-
-
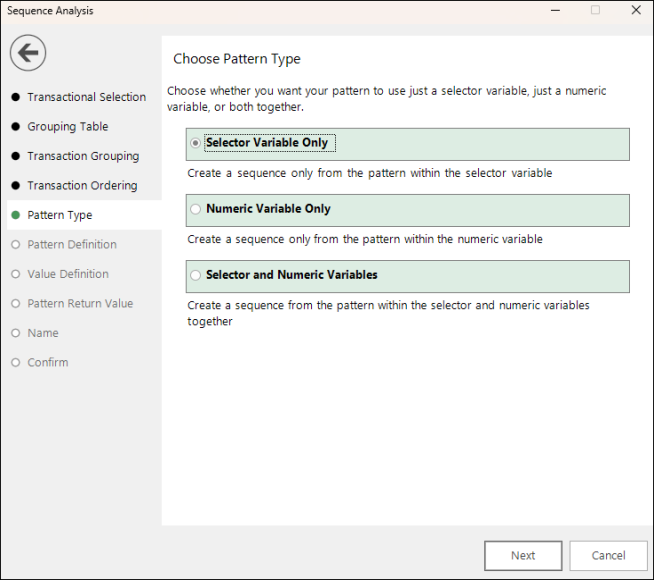
Leave the default - Selector Variable Only - as the pattern type to use.
-
First:
-
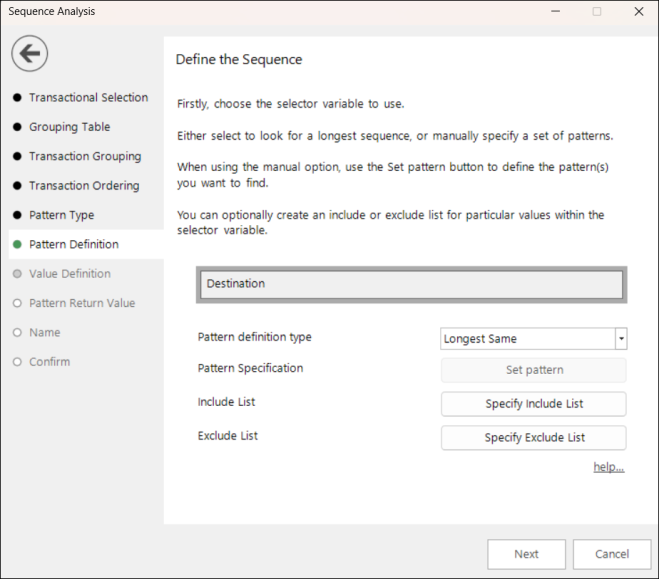
Drag and drop Destination as the pattern variable to use.
You can now use the Pattern definition type drop-down to select either a 'longest' sequence option, or define your own pattern by selecting Manual.
-
Select Longest Same.
It is possible to specify categories to include or exclude, but this is not necessary here.
-
As this is selector only pattern matching, you move directly to the Pattern Return Value step.
-
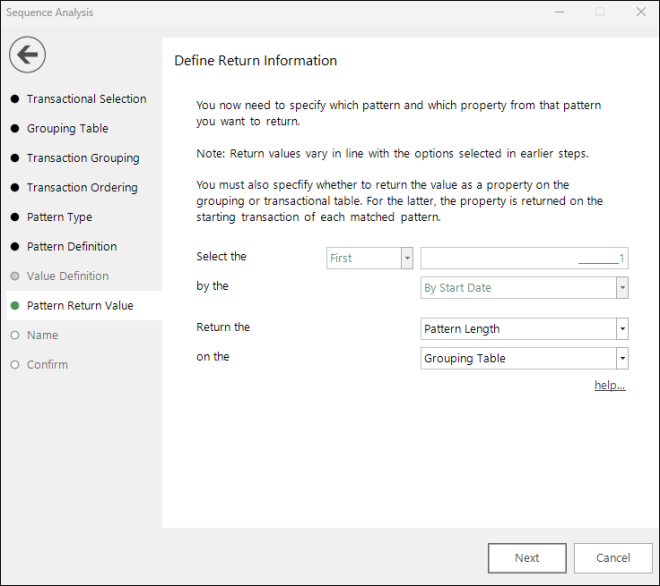
Use the Return the drop-down options to define the information you want to return. Here:
-
Select the First
-
Return the Pattern Length
-
Return as a property on the Grouping Table
-
-
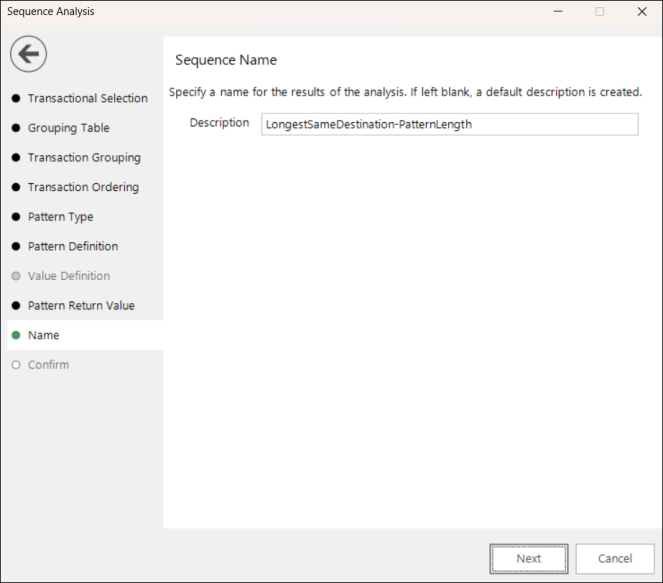
Give your pattern match aggregation an appropriate description.
-
You have the opportunity to review and, if necessary, edit your settings before creating the pattern match expression.
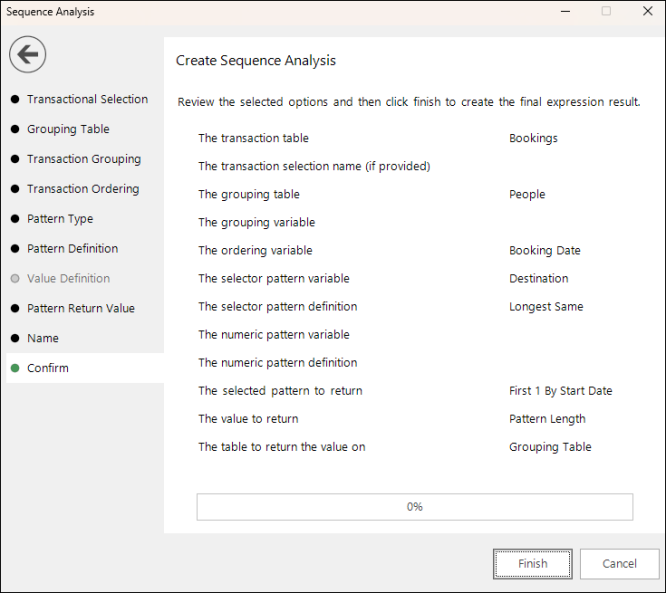
You cannot return to the wizard to make changes once you have generated the expression. You can edit settings within the expression window, or start the process again using the Sequence Analysis wizard.
Once you click Finish, a FastStats expression window opens. Switch to the on the fly aggregation tab to see the settings defined using the wizard.
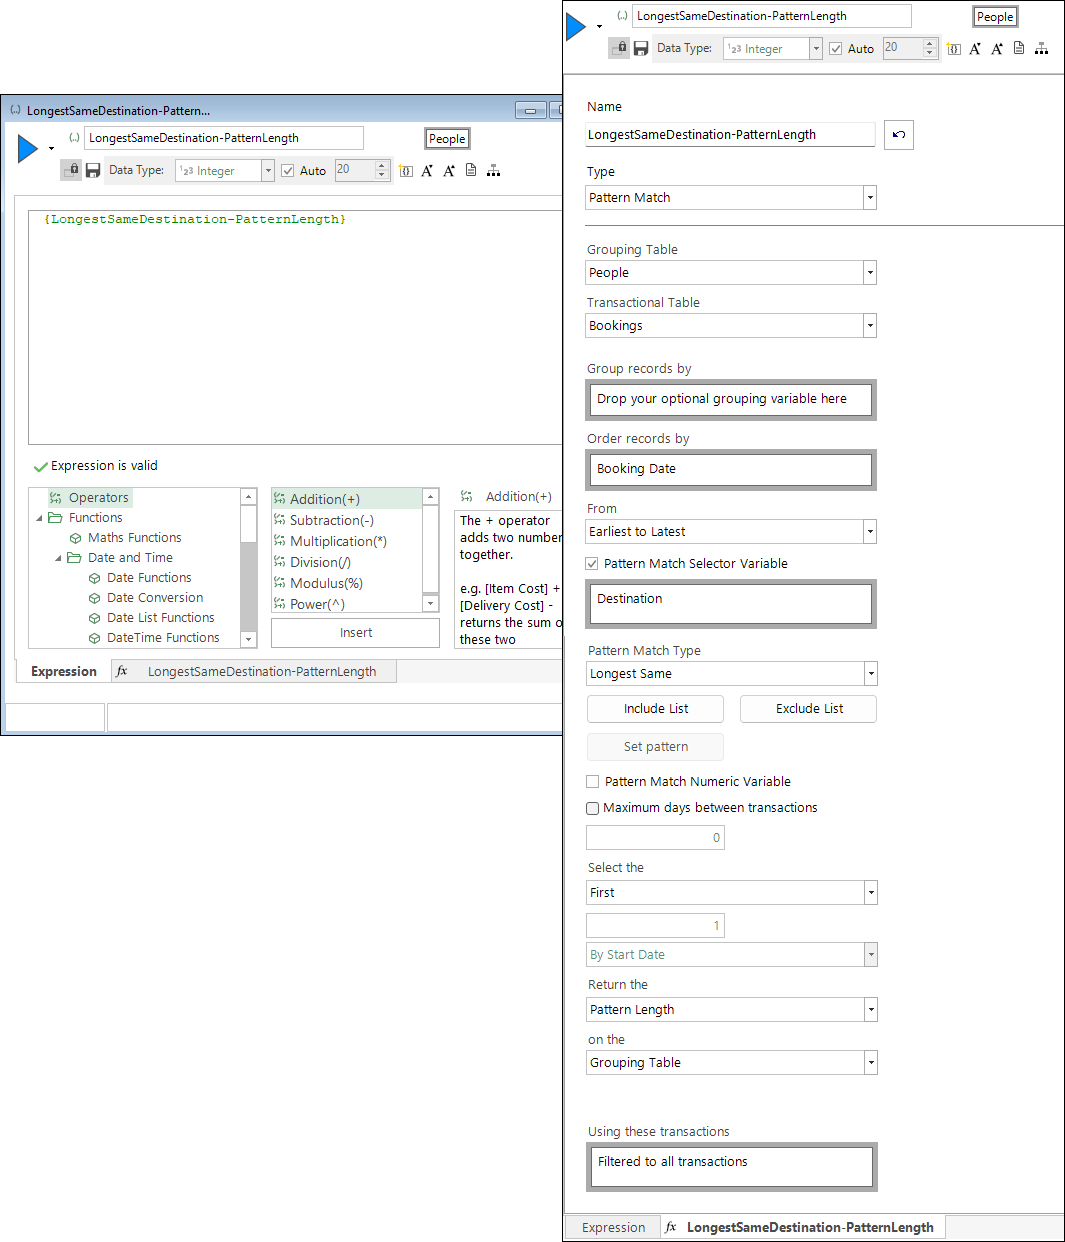
To visualise the results, drag and drop the expression onto a data grid:
Related topics: