Selecting and Tagging Dimensions
Potentially in Behavioural Modelling you can have hundreds of alternative dimensions, each exploring a different aspect of behaviour. To help you organise and manage multiple dimensions, you can make use of selecting and tagging.
Added in Q3 22
Selecting Dimensions
You can select dimensions across each of the views - chart, association grid and main list grid. The selection is highlighted and you can then amend it from the other views. Holding the Ctrl control key allows you to add or remove dimensions from the selection.
To select a range of points in the association grid, click a row or column header and then drag across neighbouring dimensions:

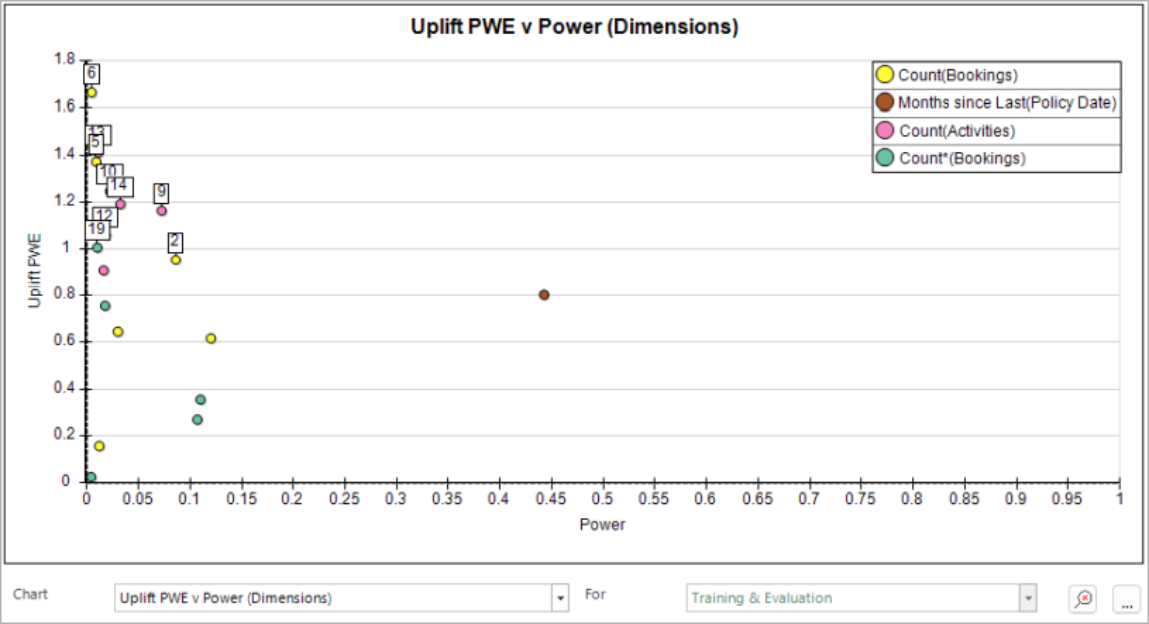
To select a range of points in the chart, click on or near the first point and then on or near a second point which defines a rectangle inside of which all the points will be selected:

Tagging Dimensions
You can tag to make a more permanent record of a selection of dimensions for further investigation.
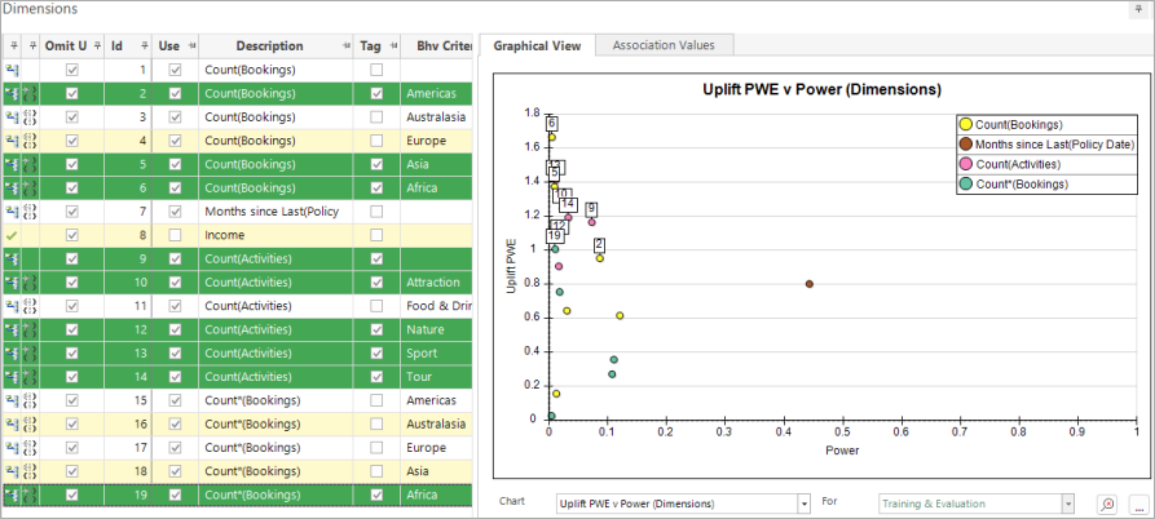
In the example below, the top niche features - which have a high uplift PWE - have been selected and then tagged using the Tag column text in the list view:

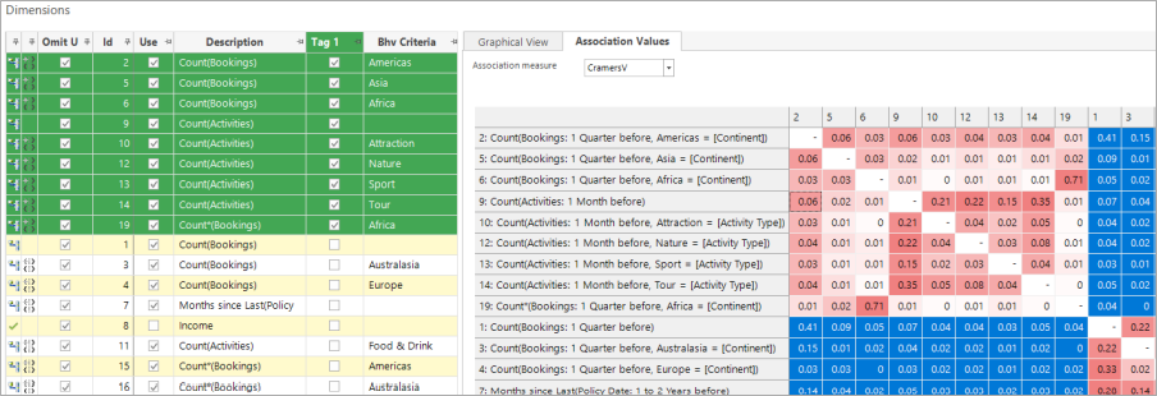
Simply sorting by the Tag column makes it easy to identify which dimension are included and, using the association values, how they are related - for example:
-
Asia and Africa are destinations which have a strong PWE, indicating that people are more likely to take insurance.
The association’s view shows a rectangle of strong thematic values indicating that these dimensions are inter-related:

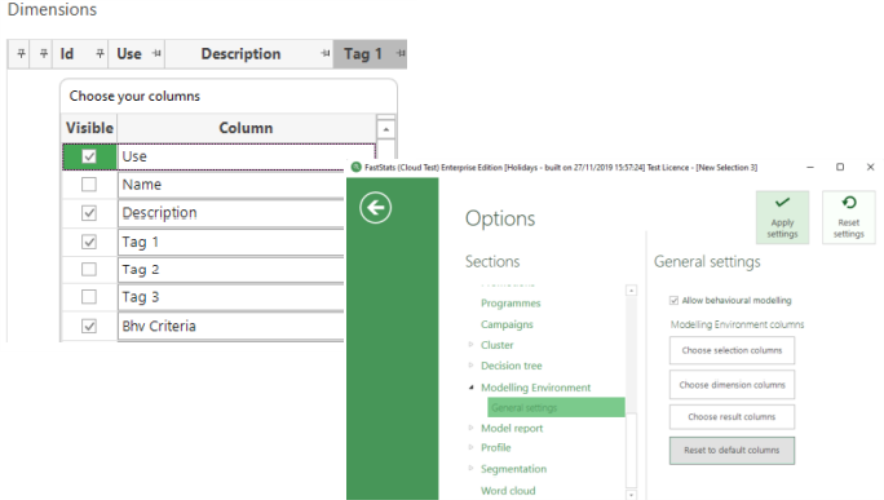
You can display a total of three Tag columns using the column chooser with only the first one visible by default. The default columns can be modified in the main Tools - Options dialog. It may also be worth resetting the default columns to improve the ordering of columns displayed in the column chooser:

Related topics: