Using Measures of Association to find Diverse Dimensions
The Dimensions tab of the Modelling Environment is where you can explore a range of possible behavioural features (dimensions) and identify those which are most useful in creating a model. You can then take this subset of the best features forward to create an actual model using PWE or Decision Tree.
The dimensions chosen to create a model should be:
1) Predictive - dimensions which can distinguish between the analysis and base selections
2) Diverse - dimensions which are not related to each other
See below for how to find diverse dimensions by using various measures of 'association' which can be relevant to standard and behavioural modelling.
For more on using graphical charts and numerical measures to help identify predictive dimensions - see Identifying the best Behavioural Features to use in a model
Added in Q3 22
Association values are calculated for all possible combinations of two dimensions and indicate how similar/related those dimensions are. You can view the numerical values in a 2-dimensional grid with values ranging from 0 (unrelated) to 1 (more similar. It is also possible to visualise this graphically using a scatter plot chart, with dimensions that appear closer together being more closely related.
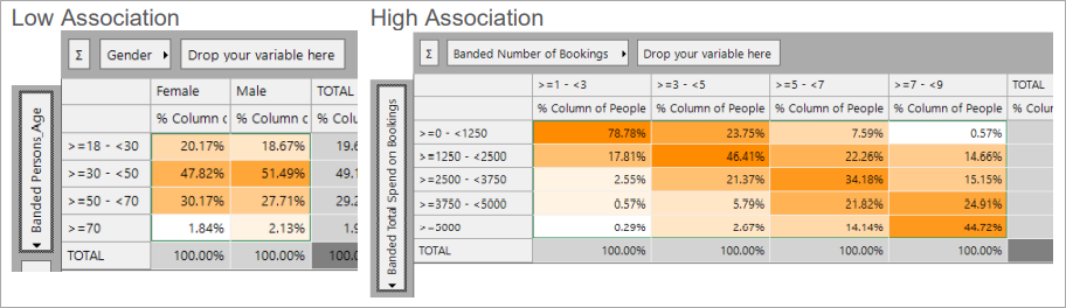
Example Associations
An example of two unrelated variables would be Gender and Age – since each gender has a very similar distribution of age bands. Knowing someone’s gender doesn’t help you to guess their age.
An example of two associated variables would be the Count of Bookings and Total Spend on Bookings. In this case a person who is in one of the high frequency bands is much more likely to be in a high spend band.
The issue with having related dimensions (i.e. high association) is that people who typically score highly on one dimension will also score highly on the other dimension, due to some underlying common cause, such as the person being a high frequency customer. If both dimensions are included in a PWE model there is a danger of double counting this effect. Note that a Decision Tree is not susceptible to this double counting - but having associated dimensions will affect performance and clarity.
Association Values
The Association Values tab gives alternative measures of the degree of similarity between dimensions. All the dimensions which are ticked as “Use” will be listed here. These results have always been available for standard modelling but are also available for behavioural features and any other banded numeric expression or variable.

The CramersV value varies between zero (no association) and one (perfect association). Each value is based on a cube such as the examples shown above. It measures the degree to which knowing the category on one variable influences the distribution of categories on the other variable.

An alternative Correlation measure is provided which is the correlation across all individual records between the PWE values that a person would receive from each of the two variables.
The correlation measure looks directly at the degree of “double counting”, going beyond the relationships between the categories of a pair of variables, to assess the PWE scores relating to the model being built. On the other hand, the CramersV values will be the same, regardless of which model you are building.
For example, if the related categories are ones which are important to the model (carry a strong PWE score) then the correlation figure will be higher. However, two variables could have a high CramersV value, but the correlation would be lower if the variables aren’t so important to the model.
Associations Chart
The association’s chart provides a visualisation of how the dimensions are inter related – more closely related dimensions will appear closer together. The chart below shows:
-
Strong association between Occupation and the socio-demographic variable Just-a-Cluster. This is because a person’s cluster is strongly driven by their occupation.
-
Strong association between Region and Town. This is because the region variable is entirely dependent on town.
-
The dimensions in the bottom left-hand corner have a reasonable level of association. This indicates that the booking summary variables are inter-related and driven by Income.

Spacing is done using a best-fit algorithm, so is only indicative.
For an exact comparison of pair-wise similarities the numerical values must be used. For example, in the bottom-left quadrant, the fact that Income is the closest dimension to Just-a-Cluster may or may not be significant; it could indicate that it is one of the drivers of this socio-demographic variable, but equally it could just be a coincidence.
The exact positioning of dimensions is not relevant - only their relative positions.
If the age band variable is added, this causes the other dimensions to move position. The age band variable takes on a central position since it is more independent and not related to any other dimensions in particular.

Related topics: