Behavioural modelling - calculations
Recency, count and value dimensions provide insight into the behaviours displayed by the analysis group and how those behaviours differ from behaviours displayed by the base group. You can potentially draw even deeper insight by adapting your behavioural features using calculations and combinations.
Calculations can be created using the predefined options which include:
-
Change from previous time frame - for example, does the change in length of a person's annual holiday predict their likelihood of not booking a future holiday?
-
Proportion - for example, what proportion of all activities are sports activities for those people who went on to purchase insurance cover?
Also:
Added in Q2 24
Your can user-define your own dimensions (behavioural features) from a calculation involving any two other dimensions.
See Behavioural modelling - user-defined calculations
Let's take a closer look at the predefined options.
Calculate as change from previous time frame
Scenario: Does a change in the duration of a person's holiday make them more or less likely to buy an insurance policy?
You can create a calculation whilst generating a new dimension, or you can select and amend an existing dimension.
-
Right click on the Average Holiday Length dimension created here - Behavioural modelling - value dimensions (behavioural features)
-
Hover over Behavioural Modelling and then select Edit Value aggregation.
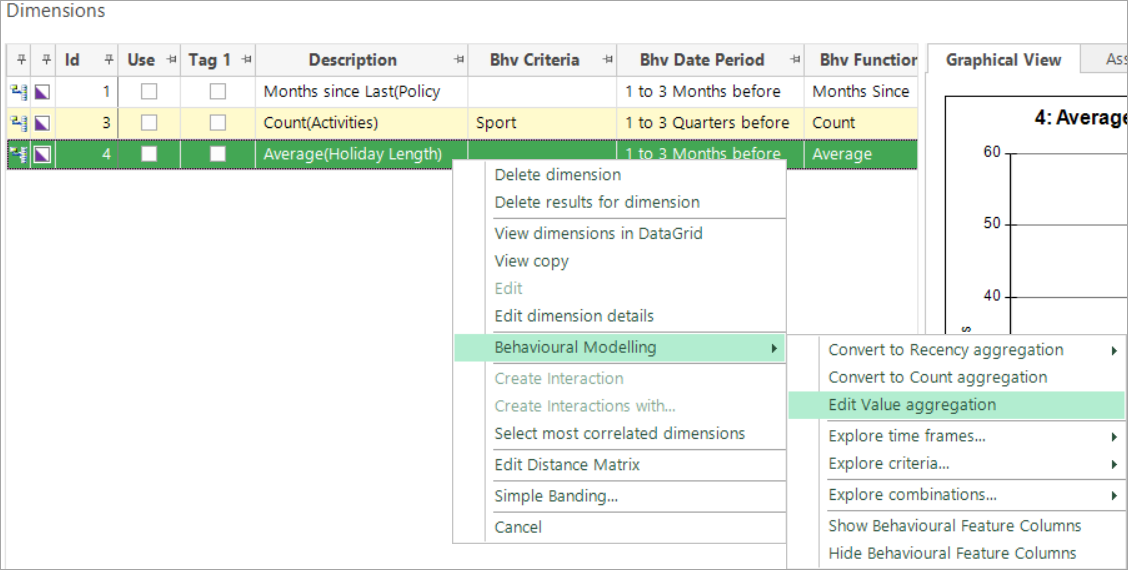
As you are editing a dimension, the existing settings are displayed.
-
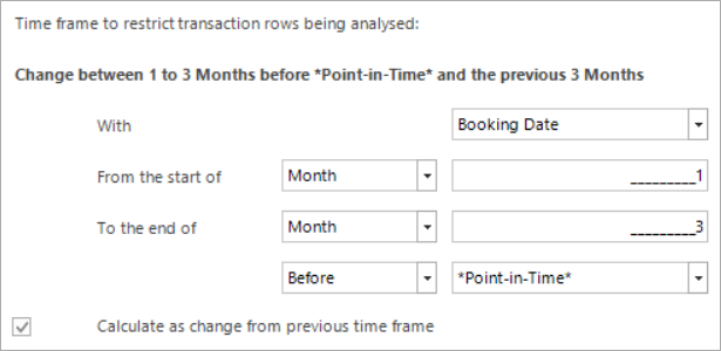
Check the Calculate as change from previous time frame box.
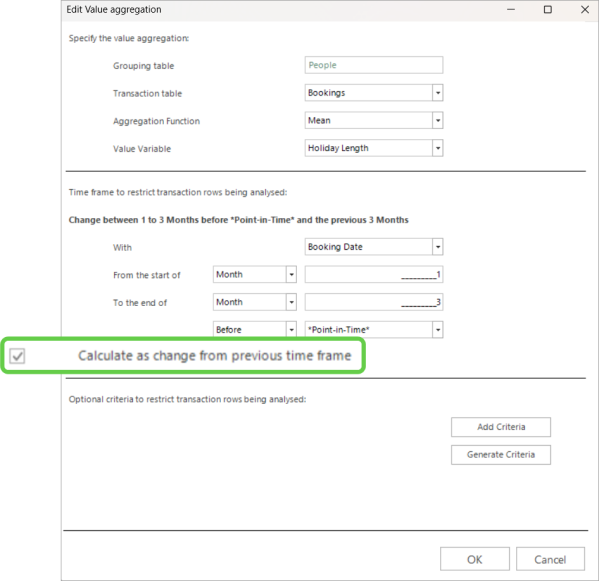
Notice the language used - Calculate as change from previous time frame:
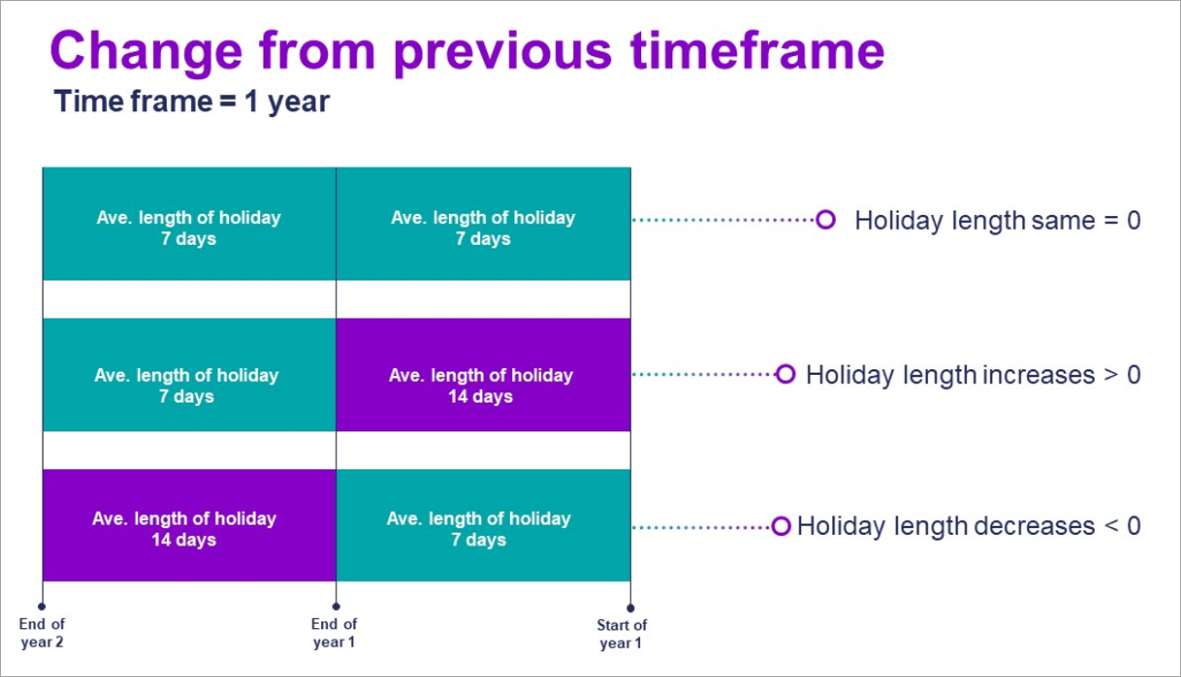
The diagram above is illustrative and not representative of the settings used in these Help examples. When the time frame to identify transactions is set to 1 year and "change from previous" is used, people's transaction lengths are identified in the year before the point-in-time and also in the year before that year. The change between the two is then calculated.
In our example, the time window is set to 1-3 months, which means the 3 months preceding the current point in time. Since this is a 3-month window, the comparison window is the 3 months before that. This allows you to examine how the average holiday length changes between 6-4 months and 1-3 months before the current point-in-time.
-
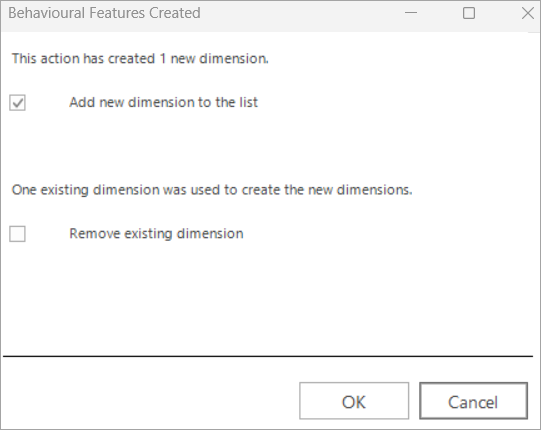
Click OK.
You can choose if your want to add this as a new dimension or replace the existing one.
-
Leave as the default Add new dimension to the list.
-
Rebuild the Modelling Environment.
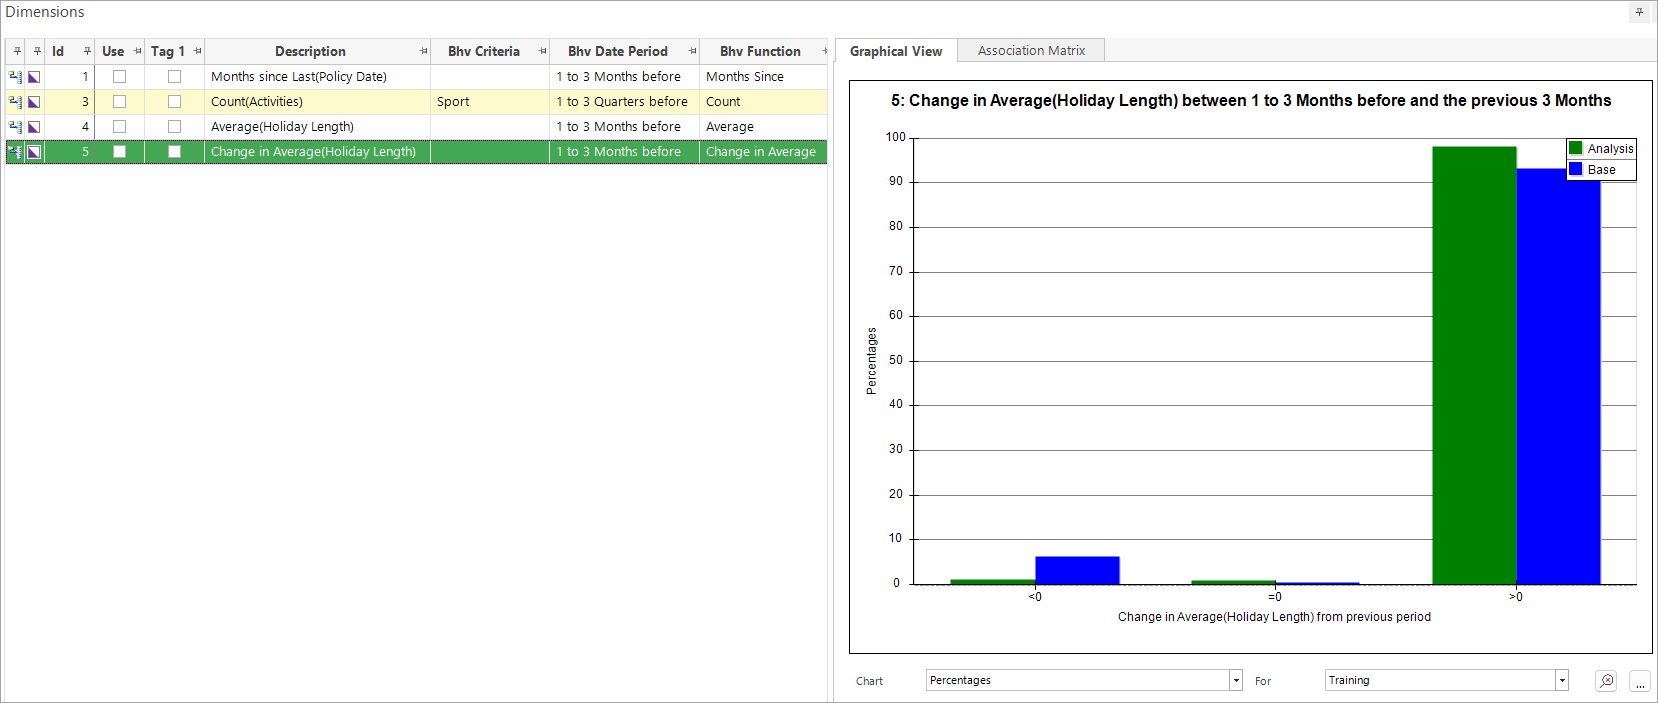
The Graphical View results illustrate what has been achieved as a result of adding a calculation:
-
<0 represents people whose length of holiday reduced
-
=0 represents people whose holiday length stayed the same
-
>0 represents people whose length of holiday increased
Proportion
To apply a proportion calculation, a dimension must have criteria and FastStats can then study what proportion the selected criteria constitutes out of all the records in that variable. This allows you to answer questions such as:
-
What proportion of all donations came from the sale of raffle tickets?
-
What proportion of all purchases were beauty products?
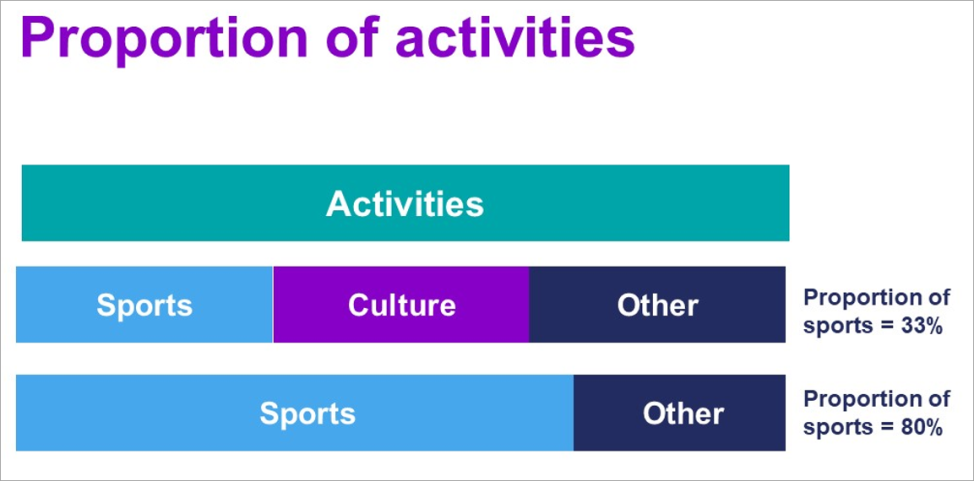
Scenario: What proportion of a person’s activities are sports activities, and what impact does this have on their likelihood of buying insurance cover?
Proportion calculations require dimensions with criteria. In this example the feature needs to:
-
Group activities up to a person level.
-
Count all of a person's activities.
-
Count a person's sports activities.
-
Calculate the percentage of a person's activities that were sports activities.
To get started:
-
Right click on the Count (Activities) dimension, hover over Behavioural Modelling and click Edit Count aggregation.
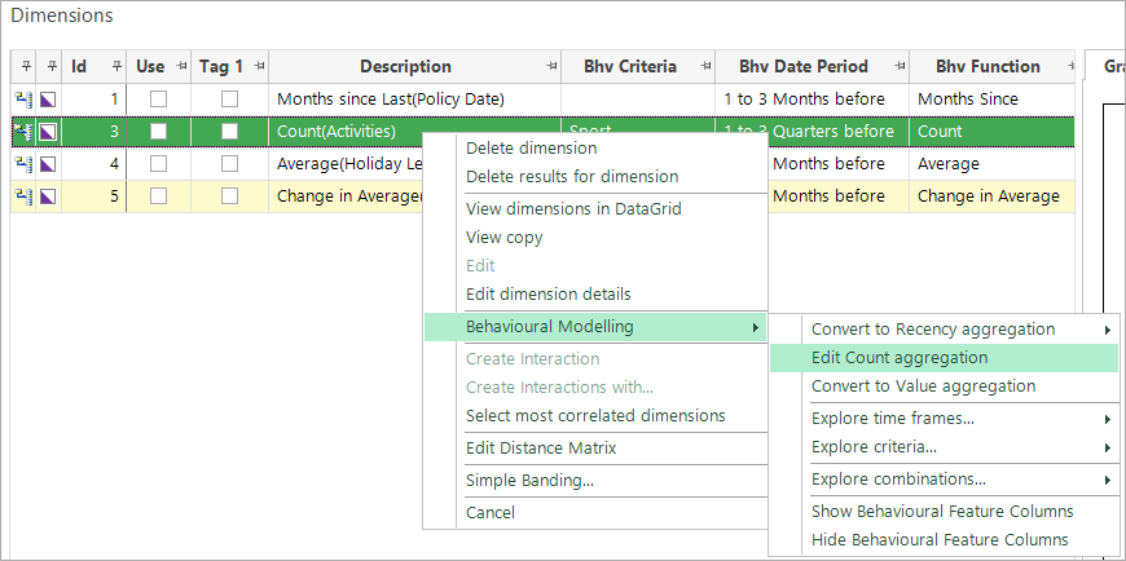
The dialogue that opens displays the existing settings
-
Check the box to Calculate as a proportion/ratio of the total and select Activity Type (in this case the only option) from the drop-down.
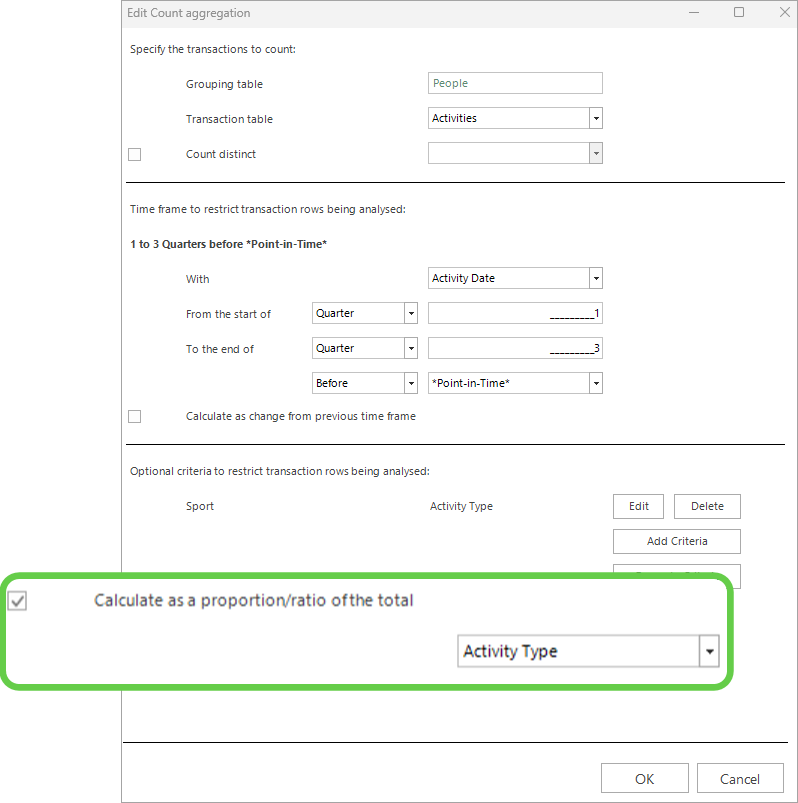
In this example, proportion is appropriate. If the behavioural feature uses functions such as mean, maximum or minimum then a ratio is used.
-
Click OK and choose if you want to add a new dimension or replace the existing one.
-
Select Add new dimension to the list.
-
Rebuild the Modelling Environment
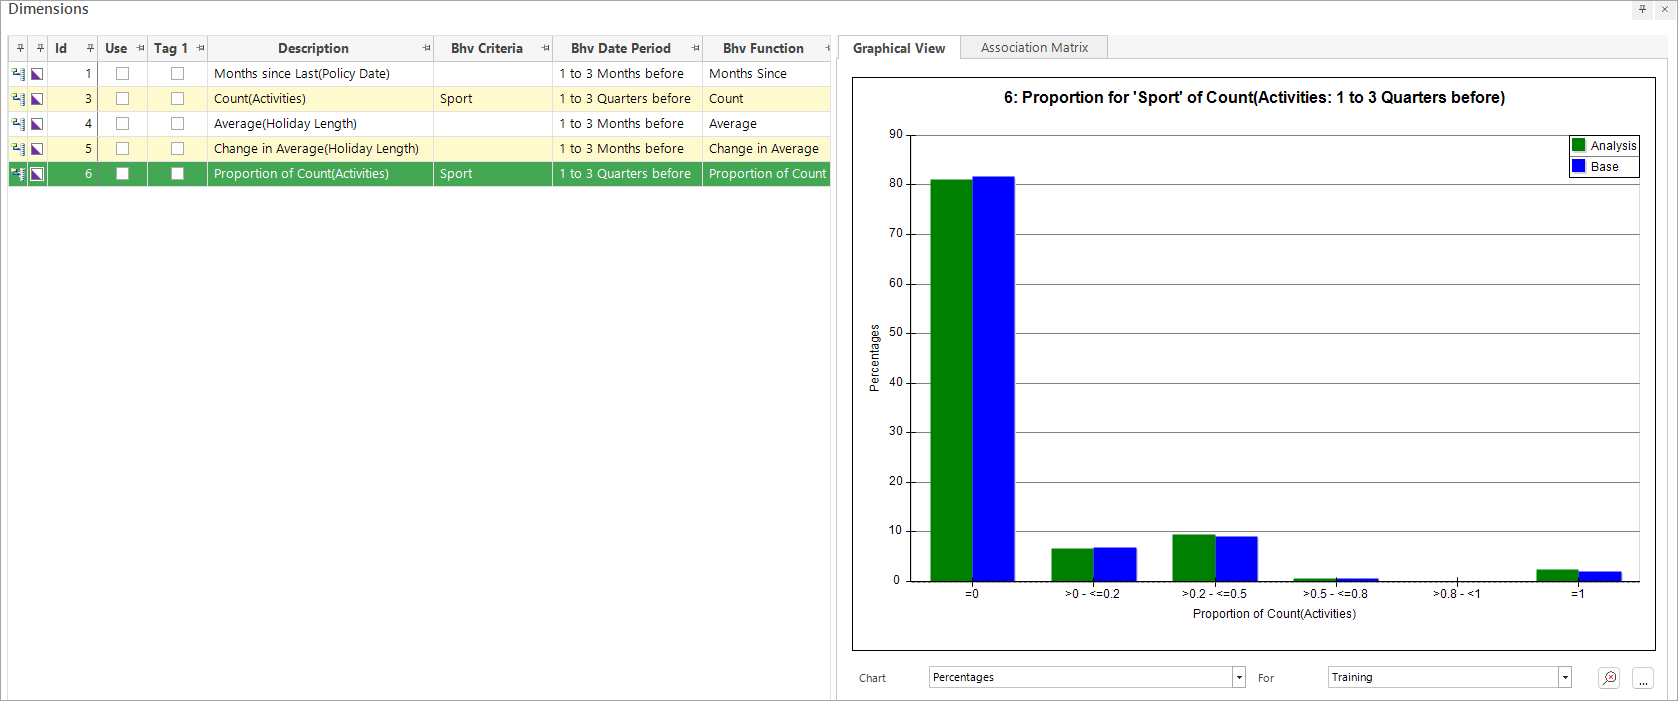
The ranges now show the proportion of sport to all activities for both the analysis and base records. For example, people whose sports activities make up between 20% and 50% of all of their activities fall in >0.2 - <=0.5 range.
See also Behavioural modelling - distinguish zeros
For related topics see Behavioural modelling - creating dimensions (behavioural features)