Numeric Banding: Geometric Ranges
The Geometric Ranges banding will create ranges of increasing width between the specified start and end value. The default is for these ranges to double in width each time. For example, 0 to 2, 2 to 6, 6 to 14 where the widths are 2, 4 and 8 respectively.
Either the number or size of ranges can be specified (the size applies to the first range). Automatic rounding can be applied to the start, end and width values in order to generate nice intervals (e.g. 0 to 2) instead of the default (perhaps 0 to 1.96). Extreme values beyond the start and end value can either be left unclassified or can be included in an extended "catch all" range.
Example
The example below is based on the holidays Cost variable with 10 Geometric Ranges with the default advanced options.
|
|
|
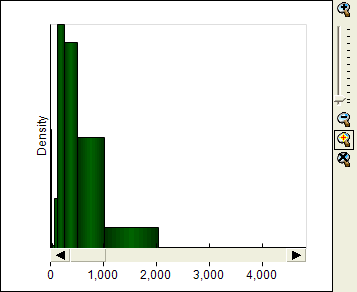
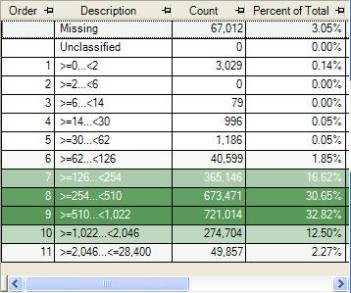
The main body of data from 0 to 2046 (containing about 98% of the data) is divided in to 10 ranges of increasing width. The width of the first range is 2 and each range doubles in size. Due to the automatic rounding applied, the ranges extend slightly beyond the exact value of the end of the main data (which is 1916).
There is an additional extended range from 2046 up to the maximum value.
There are 67,012 holidays with a missing cost value (3.05% of all holidays). All the holidays with a known cost value have been allocated to one of the ranges and none have been left unclassified.
These are shown in a density chart since the ranges are all different sizes. The range containing the extreme high values is displayed as a very long low bar, illustrating the fact that there are very few records stretched out across a large range of values. The shading in the table highlights the rows which have the most records and emphasises that there are a lot of unpopulated ranges at the low end of the scale.