Numeric Banding: Quantile Ranges
The Quantile Ranges banding will create ranges of varying width between the specified start and end value. The width of the ranges is chosen so as to allocate an equal number of records to each range, as far as is possible.
Only the number of ranges can be specified. The size of each range is determined automatically and quantile ranges are always calculated across the full range of data.
Quantile ranges can be used to create quartiles, deciles or centiles.
Example
The example below is based on the holidays Cost variable with 10 Quantile Ranges.
|
|
|
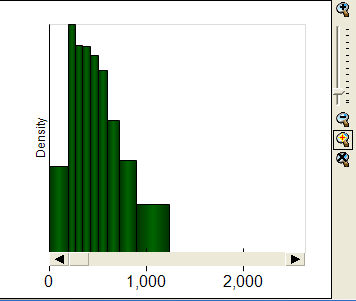
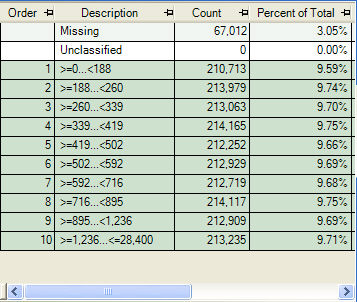
The full data range from 0 to 28,400 is divided in to 10 ranges each containing approximately the same number of records (approximately 210,000 in each). It is not possible to create ranges with exactly the same number of records due to multiple records having the same value. For example, there are over 5000 holidays with a cost of exactly 188.0. Since the value 188 forms the boundary between the first two ranges, the second range is slightly large as it is the one which contains all the records with a value of 188.
There is no additional extended range and the last range is equivalent to all other ranges in that it contains approximately 10% of the data.
There are 67,012 holidays with a missing cost value (3.05% of all holidays). All the holidays with a known cost value have been allocated to one of the ranges and none have been left unclassified.
These are shown in a density chart since the ranges are all different sizes. The last range which includes the extreme high values is displayed as a very long low bar, illustrating the fact that there are very few records stretched out across a large range of values. The consistent shading in the table highlights the fact that all the ranges contain a similar number of records.