Bing Maps: Shaded Map - Viewing the Results
|
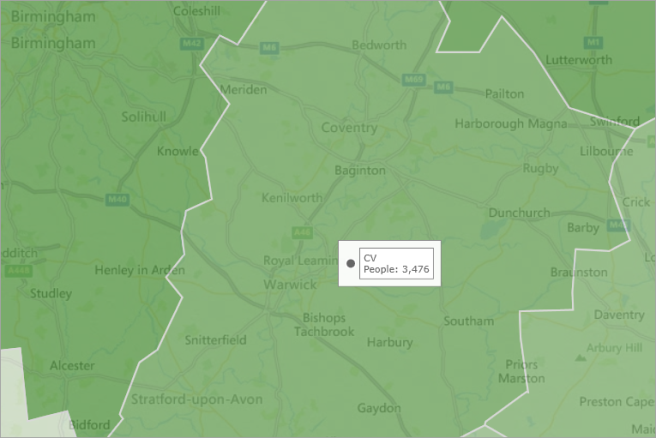
The map opposite is zoomed in over the Midlands region of the UK. The result of the underlying selection (here Australian Holidaymakers) has been applied through the coloured shading. Depending on the settings used, the legend may have a wide range of results associated with a particular colour. Move the mouse pointer over a Postal Area of interest to see a tooltip display of the count. To select results from the map, there are a selection of tools available in the drawing tool bar at the top of the window:
In this example, we will use the Scribble tool. |
|

-
Click on the Scribble tool and then click and hold the left mouse button to draw a joined up shape
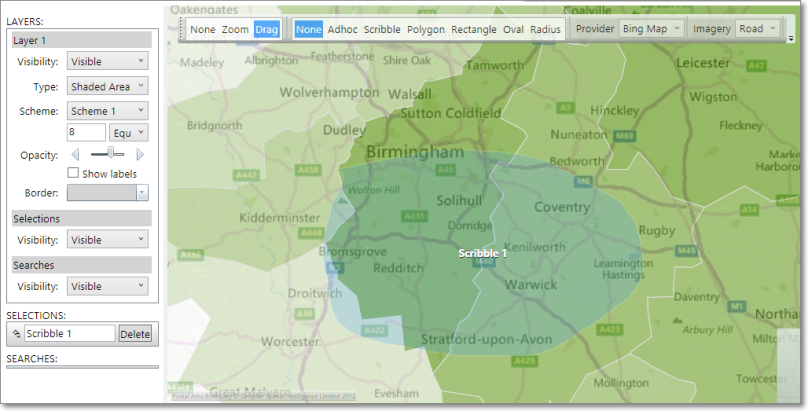
An item will be entered under the Selections section of the Layers panel.
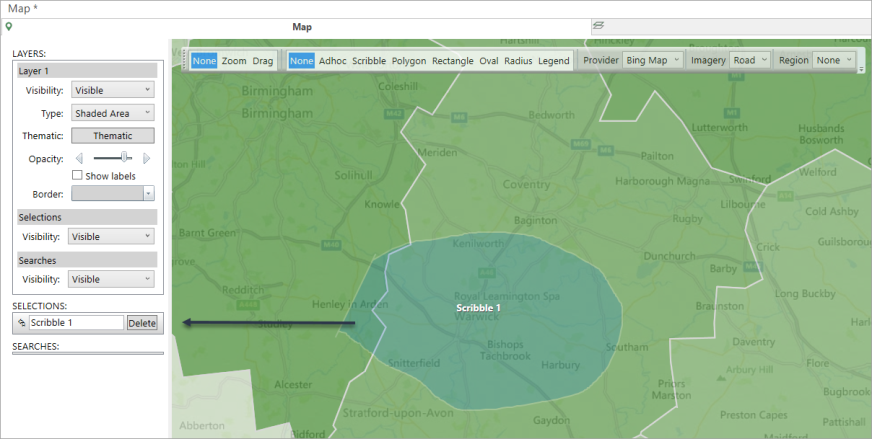
- Click and drag the
 Selections button onto the workspace to see and count the selection

Note:
The line drawn may cross several Postal Areas, so how does FastStats interpret your shape?
FastStats looks to see if your line crosses the border of a geographical variable and, if it does, it will include everyone in that area. For a more accurate result, you can:
-
use a more granular variable - for example Postal District or Sector
-
when configured, use longitude and latitude variables from your System explorer to turn any map shape into a selection that exactly matches the shape you draw
For more information on making selections from a map, see Bing Maps: Selecting from the Map
For information on using segment variables, see Bing Maps: Shaded Map - Using a Segment Variable
For information on adding statistics, see Bing Maps: Shaded Map - Adding Statistics