Configure plot mapping
When you use the Plot Map feature, keep the number of records you plot to a sensible amount. Many records slow the plotting process.
Once you have made your selection, drag the Map tool onto it.
Note
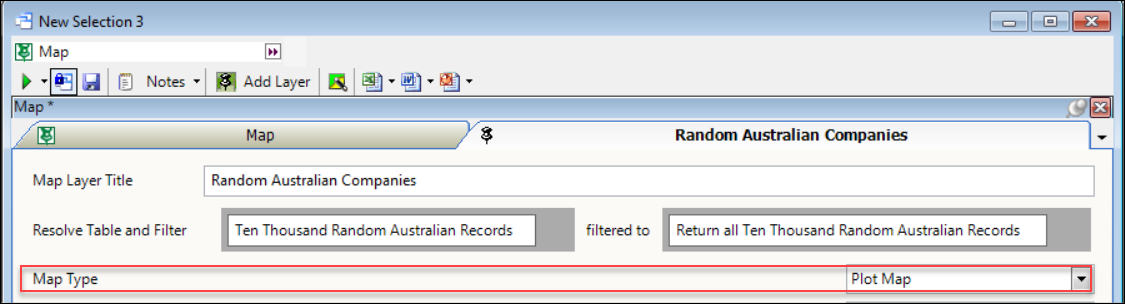
You can rename the layer to something appropriate and change the Map Type to Plot Map.
Add one or more of the following variables to the plot map layer. Typically, you add the most detailed data item (such as the postcode) as the Geographic field, and add the other fields as additional variables.
Geographic variables
FastStats only uses fields for geocoding that have a description or geoformat of:
- Longitude
- Latitude
- Zip
- Postcode
- Address
- Country
If you populate Longitude and Latitude, FastStats doesn't need to perform geocoding.
Note
It's best to include a Country field to enable better evaluation of postcodes between potential duplicates.
If you have named these variables differently in your FastStats system, you can use Expressions to create Virtual Variables. Use these names as the description. If you don't have them with these descriptions, plotting doesn't work.
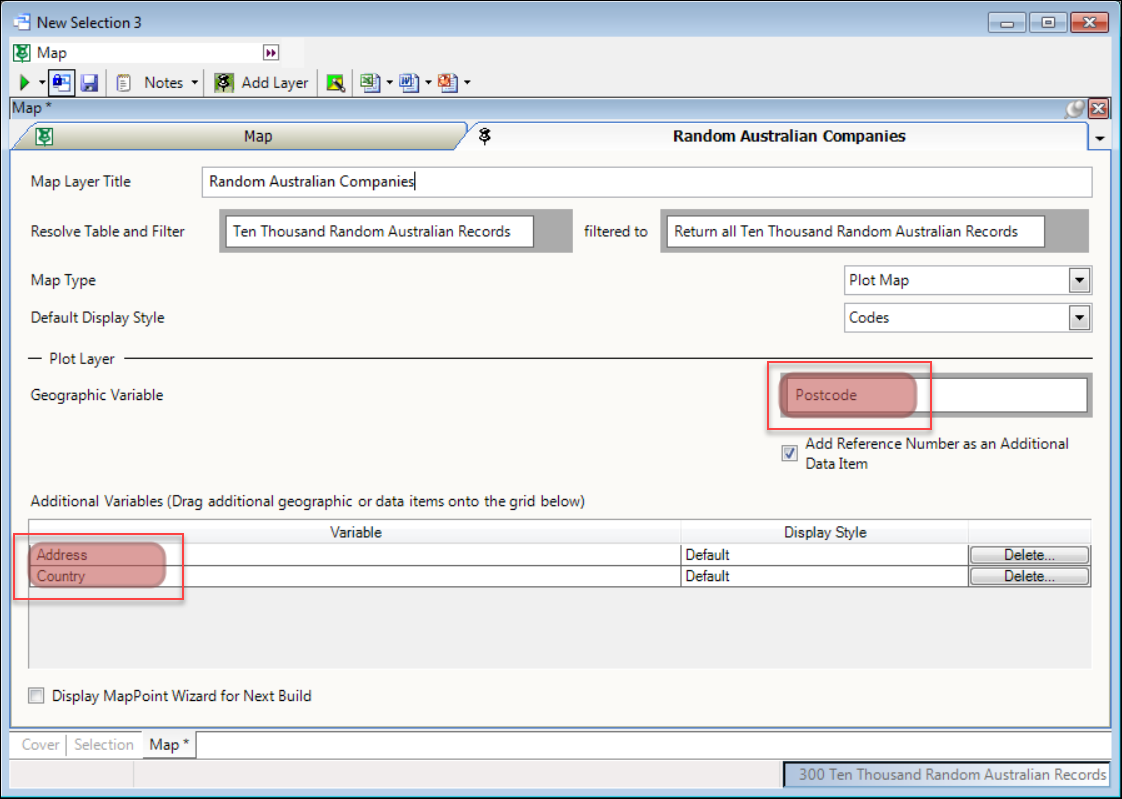
For example, drag the Postcode variable onto the Geographic Variable. Then drag the Address variable and Country variable onto the Additional Variables.
Building the plot map
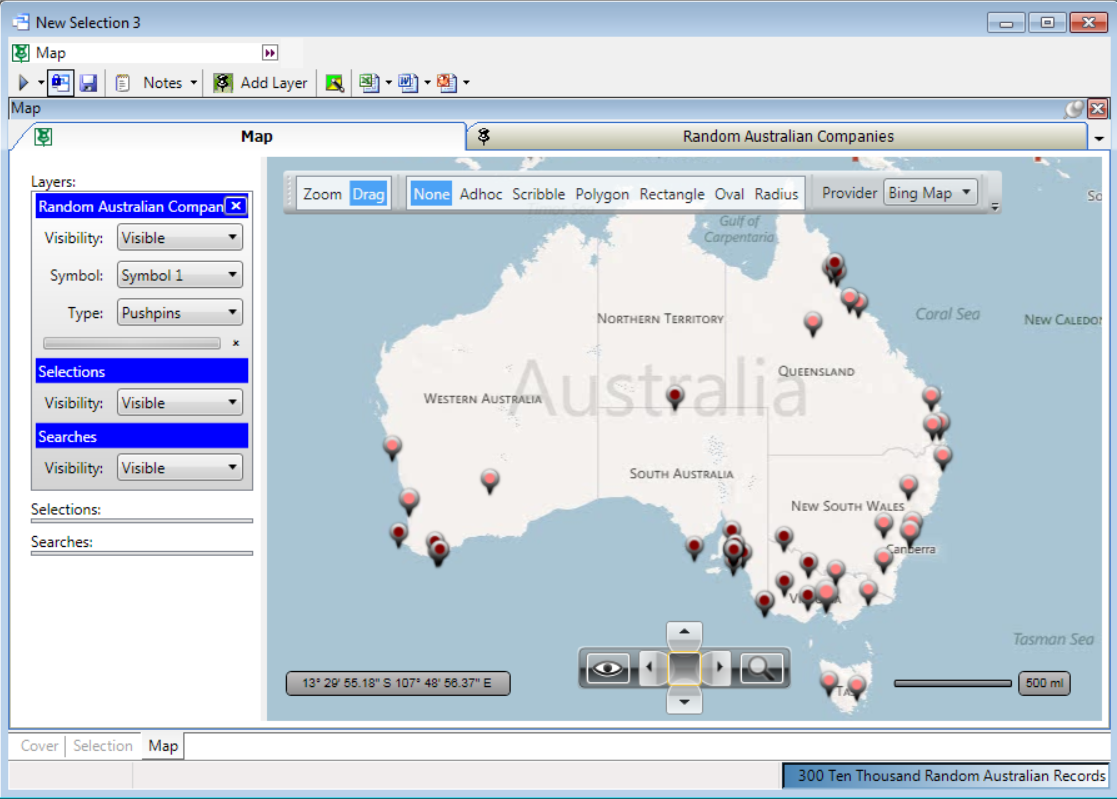
Select Build, and the Plot Pushpins appear on the map.