Collections
Apteco offers various methods to analyse, visualise, and interpret patterns in your data. You can use a Cube to display a cross-tabulation of data that describes a specific selection. Alternatively, you can use the combination of FastStats and Excel to refresh and describe data using Excelsior.
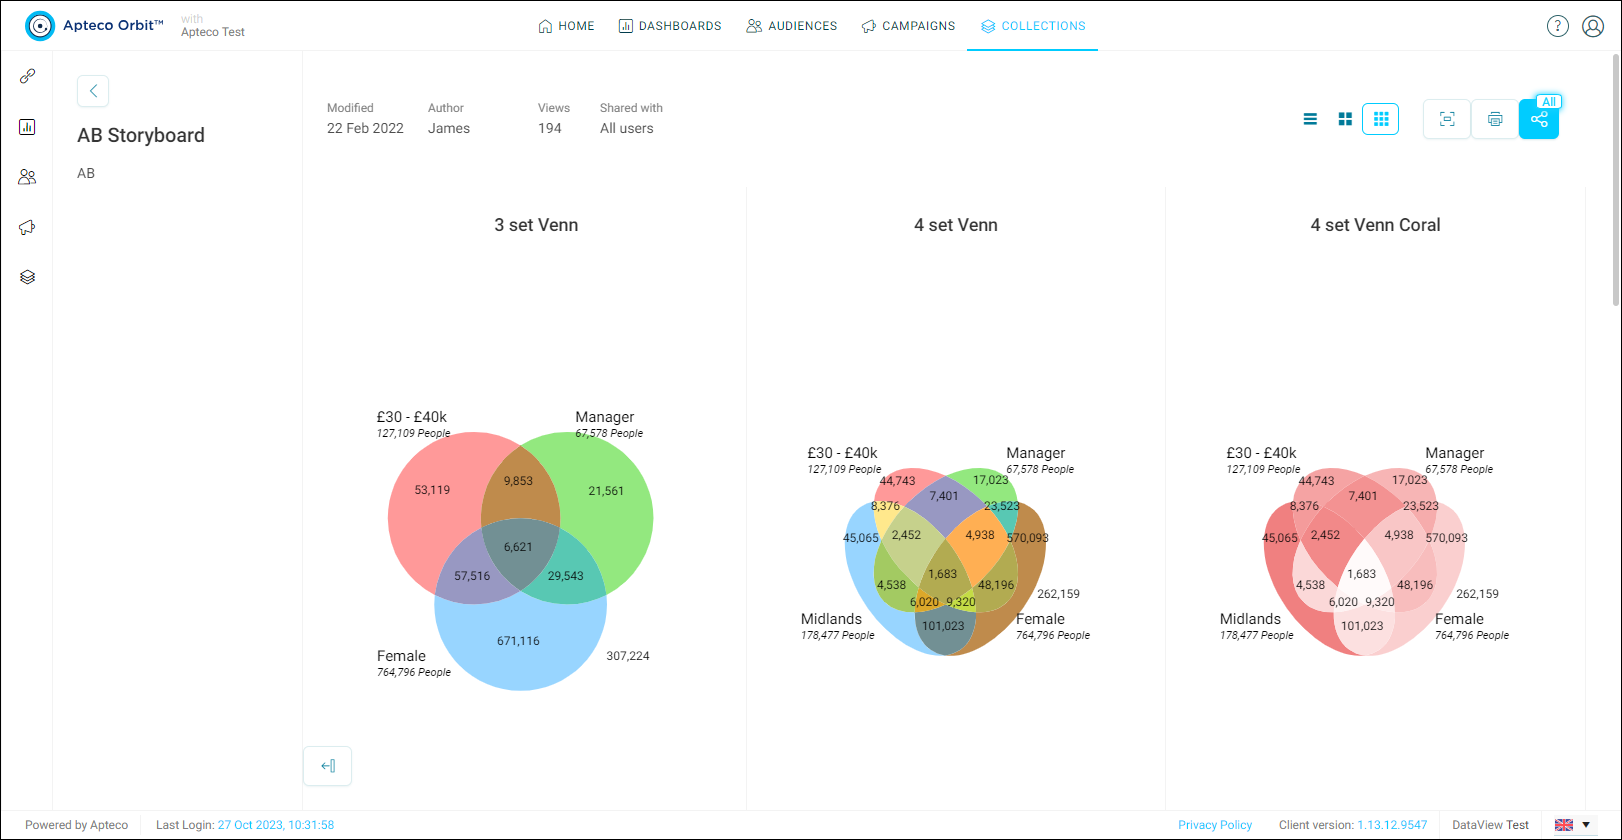
FastStats also provides the Storyboard ribbon bar, which lets you prepare and share insights as a sequence of annotated results. The Charting tool supports Cubes, Data Grids, Venn diagrams, and seven different chart types.
Once created, you can publish your Storyboard straight to PDF or Word. Alternatively, you can share the report with FastStats and non-FastStats users around the business using Orbit.
Once in Orbit, your Storyboard becomes a Collection that you can open, along with anyone you shared the report with. This lets everyone see the latest results from your FastStats system.