Campaign-linked dashboards
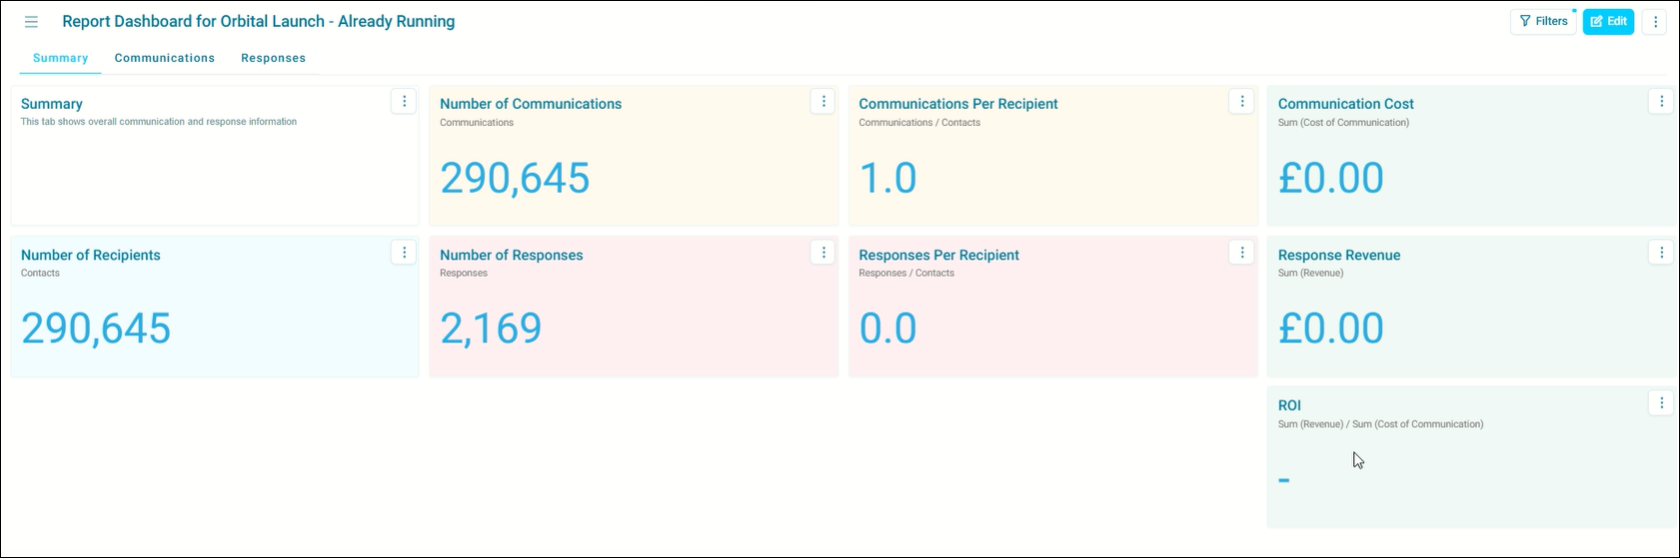
Create dashboards directly from a published campaign to display customisable campaign-specific metrics and visualisations. Rather than repeatedly creating new dashboards, you can quickly access the relevant campaign statistics you need. Dashboards generated from campaigns serve as starting points for you to analyse your marketing effectiveness. You can then fully customise and tailor your dashboard to your specific needs by adding new attributes, adjusting filters, or applying themes.
Key benefits:
- Dashboards are pre-populated with key metrics, saving setup time
- You can customise dashboards to include additional metrics and filters
- Dashboards can leverage both real-time data (via SQL tables) and synchronised FastStats data, providing options for different reporting needs
Dashboard types
There are two types of campaign-linked dashboards, each serving different purposes:
- Tracking dashboard
- Reporting dashboard
Tracking dashboard
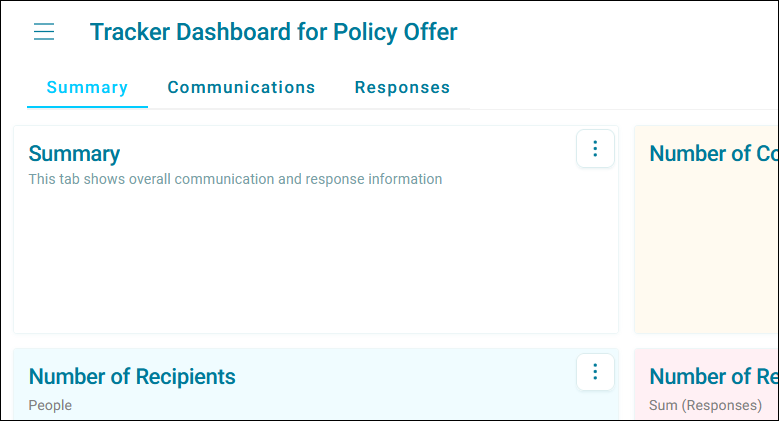
Tracking dashboards pull real-time data from SQL tables which is ideal for monitoring live campaign progress. While you can add FastStats attributes, these updates are not in real time. These dashboards provide immediate stats, such as communication counts and response rates, making them perfect for 'on-the-fly' decision-making.
Example use cases
Real-time monitoring
You can track live updates on email sends, responses, and costs to make immediate adjustments during a campaign.
Flash sale tracking
Your marketing team monitors real-time sales and ROI during a 24-hour sale to optimise promotions.
Reporting dashboard
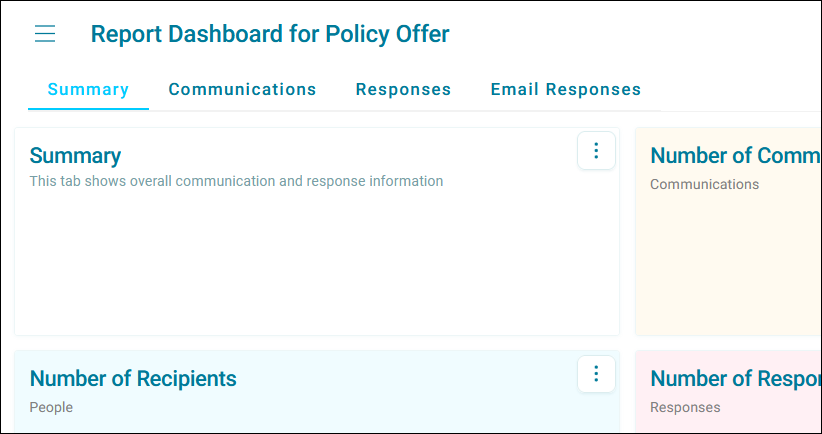
Reporting dashboards use synchronised FastStats data for detailed, periodic analysis, such as monthly or quarterly reports. They provide consistent metrics like ROI, revenue, and segmentation insights, making them suitable for in-depth performance evaluation.
Example use cases
Quarterly reports
You can review reconciled metrics like ROI and revenue for a detailed management report.
Segment analysis
Your marketing team evaluates responder behaviour across customer segments using consistent FastStats data.
Creating a campaign-linked dashboard
You can create a dashboard from your campaign that then remains linked to its specific journey and displays customisable metrics from its runs.
Note
You can only create dashboards from published campaigns.
Note
You must have Recording communication history turned on to use campaign-linked dashboards.
To create a dashboard from a campaign:
- Publish your campaign and ensure you are in view mode.
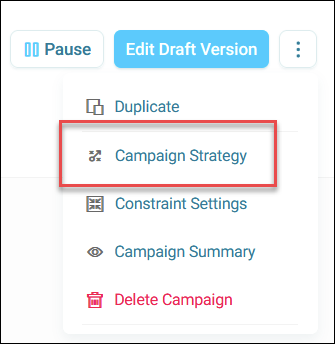
- Open your campaign journey, then click the option menu in the top-right corner.
-
Click Campaign Strategy.
-
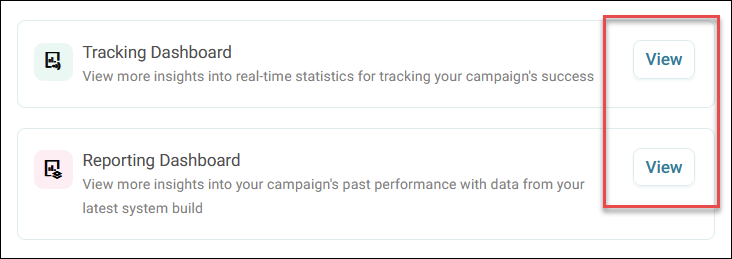
Choose the type of dashboard you want to create:
- Tracking Dashboard
- Reporting Dashboard
-
Click View next to your choice.
Note
You don't need to apply any Campaign goals or Message objectives to launch a dashboard. However, without them, your dashboard cannot benefit from metrics like Return on Investment (ROI), revenue, and responses.
Once complete, you can launch a dashboard created from a campaign with predefined metrics on number card tiles, adding it to your list of dashboards.
Note
If you need a fresh version of a dashboard, delete or rename the existing one in your dashboard list. Then, relaunch the dashboard from the campaign to generate a new instance.
You can now fully customise your dashboard using all the tools available in the dashboard editor to meet specific campaign reporting needs.
Default metrics in campaign-linked dashboards
When launched, campaign-linked dashboards include the following summary metrics on number tile cards:
| Metric | Definition |
|---|---|
| Number of communications | Total sent communications for the campaign. |
| Number of recipients | Count of unique individuals targeted by the campaign. |
| Response count | Total responses recorded, based on campaign objectives. |
| Revenue | Total revenue generated, as defined by objectives. |
| Cost | Communication cost, derived from campaign channel setup. |
| ROI (Return on Investment) | Calculated using revenue and cost data, if objectives are defined. |
| Progress tracking | Campaign progress against defined goals and objectives. |
Note
To view metrics like ROI, revenue, and response count, you must set up Message objectives in the campaign. Without them, these fields remain blank.
Best practices
Set clear goals and objectives
Define campaign goals to unlock advanced metrics like Return on Investment (ROI) and response tracking
Use appropriate dashboard types
Choose a Tracker Dashboard for real-time monitoring and a Report Dashboard for periodic analyses
Organise your dashboard library
Regularly review and clean up unused dashboards to prevent clutter. Rename dashboards with descriptive titles that indicate their purpose
Leverage customisation
Tailor dashboards to include brand-specific metrics or variables relevant to your campaigns
Share with your team
Share campaign-linked dashboards with team members for collaboration or review.
Customising your dashboard
Campaign-linked dashboards are flexible tools that you can use adaptively to meet specific campaign reporting needs, with all customisation options available.
Launch your dashboard
To launch your dashboard, either:
-
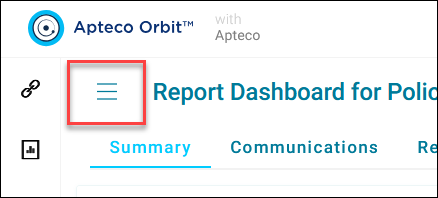
Locate the dashboard in your user-specific list and clicking the menu button in the top-left corner.
-
Relaunch your dashboard directly from the associated campaign journey.
Click Campaign Strategy, then select your dashboard type.
Relaunching opens the saved version, including all prior edits. This ensures you're working with the correct starting point.
You’re now ready to customise your dashboard.
Customising your dashboard
Your campaign-linked dashboards have all the customisation options that regular dashboards have.
To customise your campaign-linked dashboard:
-
Add or modify the tiles and metrics on your dashboard.
- Use the editing interface to include additional metrics and visualisations that are relevant to your analysis, such as segmentation variables, industry-specific KPIs, or additional FastStats attributes.
- Apply filters to focus on specific audiences, channels, or timeframes.
- Customise the visual presentation by adjusting themes or chart types to suit your reporting preferences.
-
Click Save.
Note
Saved dashboards remain linked to your campaign, providing easy access for future use.
-
Review your modified dashboard to verify that updates correctly display the intended data.
You now have a customised campaign-linked dashboard you can share with your team.