Campaign reports
Campaign reports are dashboards that Orbit builds for a campaign, with its key metrics already in place. Open them from the campaign's Overview tab to see how the campaign is doing, without building a dashboard yourself.
Each report is a starting point, set up with sensible defaults for the campaign. It's an ordinary dashboard, so you can open it in Dashboards and change anything about it to suit your reporting, as you would any other dashboard.
Before you begin
To view a campaign's reports, you need:
- A Campaigner licence or higher (Broadcaster licences don't include campaign reports)
- A live campaign (not an area or folder of campaigns)
- Communication history recording turned on
Metrics such as revenue, responses, and return on investment (ROI) also need message objectives in the campaign, and goal progress needs a campaign goal. Without them, those tiles show no figures.
Objectives also need some tables and tagged fields in your FastStats system. A system administrator can add them by following Configure Orbit for campaign reporting.
Tracking and reporting
Each campaign has two types of report. Choose the one that fits the question you're asking.
Tracking
Tracking uses real-time statistics to track your campaign's progress. It gives you immediate figures, such as communication counts and response rates, so you can make decisions while a campaign is running. You can add FastStats variables to a tracking report, but they don't update in real time.
Example use cases
Monitoring an appeal: During a 24-hour emergency appeal, your team watches sends, responses, and costs as they come in, and adjusts the follow-up messages.
A short fundraising push: Over a weekend matched-giving push, you check the response rate and ROI every few hours to decide whether to extend it.
Reporting
Reporting uses data from your latest system build to review your campaign's progress. It gives you consistent metrics, such as ROI, revenue, and how different segments responded, for a detailed review at regular intervals.
Example use cases
Quarterly reports: You review the reconciled revenue and ROI for a quarterly report to your trustees.
Segment analysis: Your team compares how different supporter segments responded to the campaign, using consistent data from your system.
View a campaign's reports
To view a campaign's reports:
-
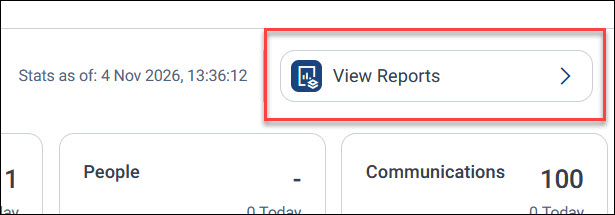
Open a live campaign, and on its Overview tab, select View Reports.
-
In the Select Report Type dialogue, select Tracking or Reporting.
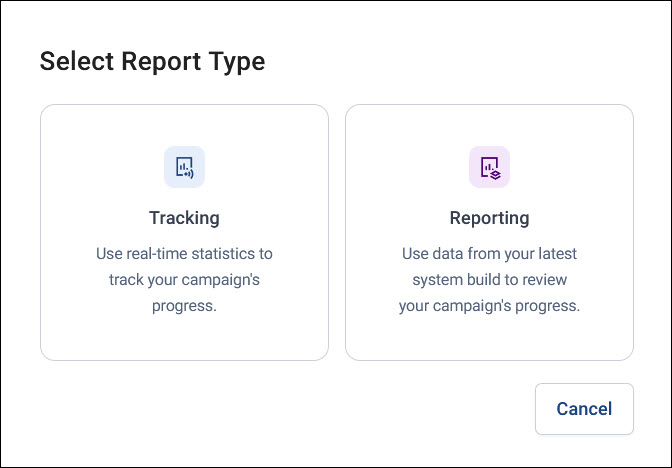
The first time you open a type of report for a campaign, Orbit creates its dashboard, named Tracker Dashboard for or Report Dashboard for followed by the campaign name.
-
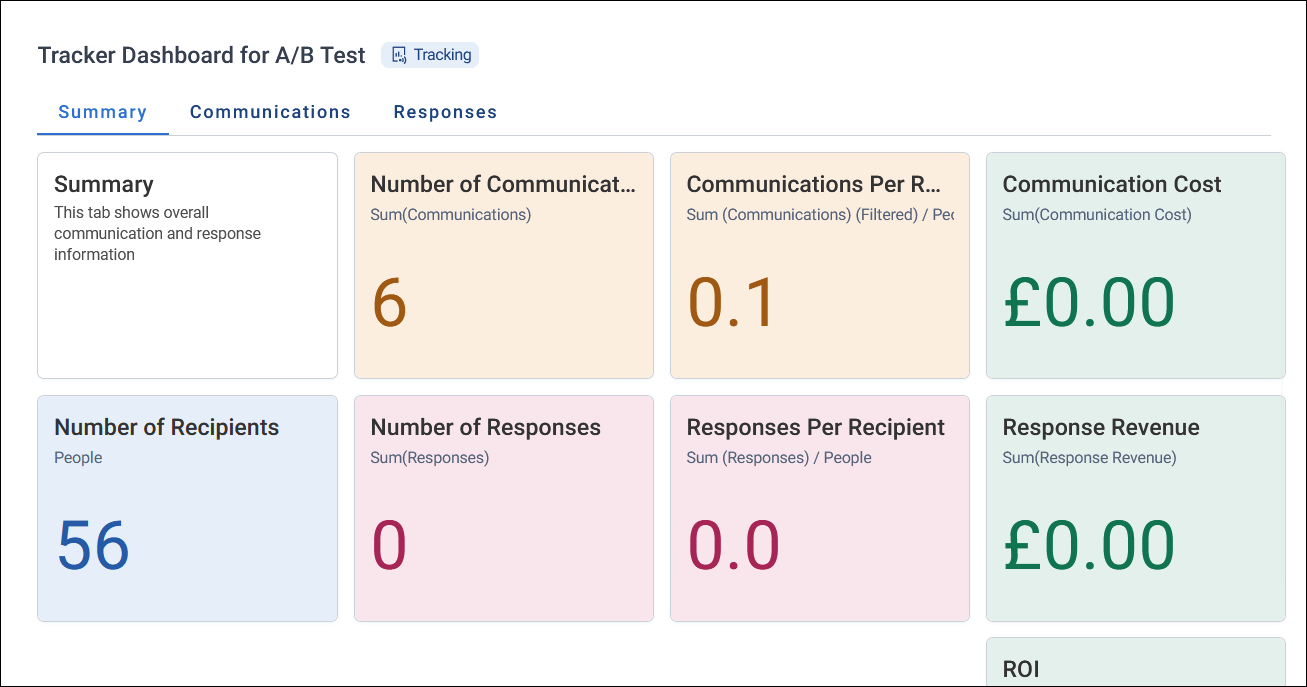
Review the report in the preview. It shows the latest figures each time you open it. Select a tab to see each part of the report.
-
Select Close to go back to the campaign, or View in Dashboards to open the report as a dashboard.
What's in a report
Each tab of a report covers one part of the campaign, and starts with a tile that describes what's on it.
Tracking report
| Tab | What you'll find |
|---|---|
| Summary | The campaign's key figures at a glance: communications and recipients, responses, cost, revenue, and ROI |
| Communications | How many communications went to how many recipients, and what they cost, including per recipient |
| Responses | How many responses the campaign received and the revenue they brought in, including per recipient, ROI, and cost per response |
Reporting report
| Tab | What you'll find |
|---|---|
| Summary | The campaign's key figures at a glance: participants, communications, responses, revenue, and ROI |
| Communications | How many communications went to how many participants, and what they cost, with charts by channel and by message, and for the last week |
| Goal | If the campaign has a goal, its progress towards the goal over the goal's timeframe |
| Responses | How many responses the campaign received and the revenue they brought in, with charts by response type and for the last week |
A reporting report also has Marketing Effectiveness and Financial Effectiveness tabs.
Work with a report in Dashboards
When you select View in Dashboards, the report opens as a dashboard. The default tabs and tiles are there to get you started, and you can edit, add, or remove any of them, just as on any other dashboard. For example, you can:
- Add tiles for other variables, such as supporter segments or donation channels
- Remove tiles or tabs you don't need
- Filter the report to particular audiences, channels, or time periods
- Change the dashboard's theme or a tile's chart type
Save the dashboard to keep your changes. It stays linked to its campaign, and opening the report from the campaign again opens the saved version. You can also share the dashboard with colleagues, as with any other dashboard.
To start again from the default report, delete or rename the dashboard, then select View Reports on the campaign again.
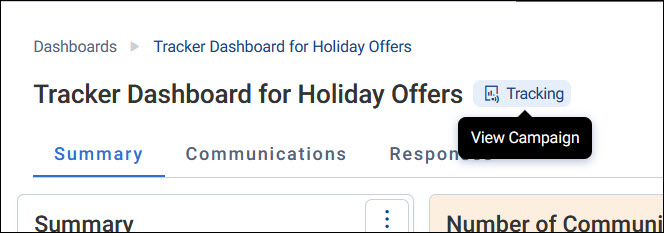
A badge next to the dashboard's name shows whether it's a Tracking or Reporting report. To go back to the campaign, select the badge.
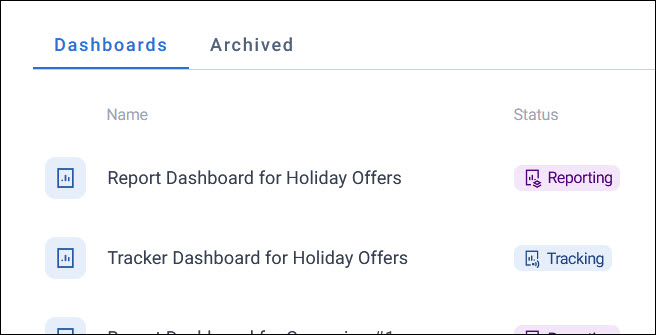
In the Dashboards list view, the Status column shows the same badges, so you can pick out a campaign's reports.