Penetration maps
You can use penetration maps to see how a specific group of customers spreads across a map, compared to the overall customer base.
Explainer: Penetration maps
In this example:
-
The analysis group consists of people who've booked a holiday to Sweden.
-
The base includes everyone in your system.
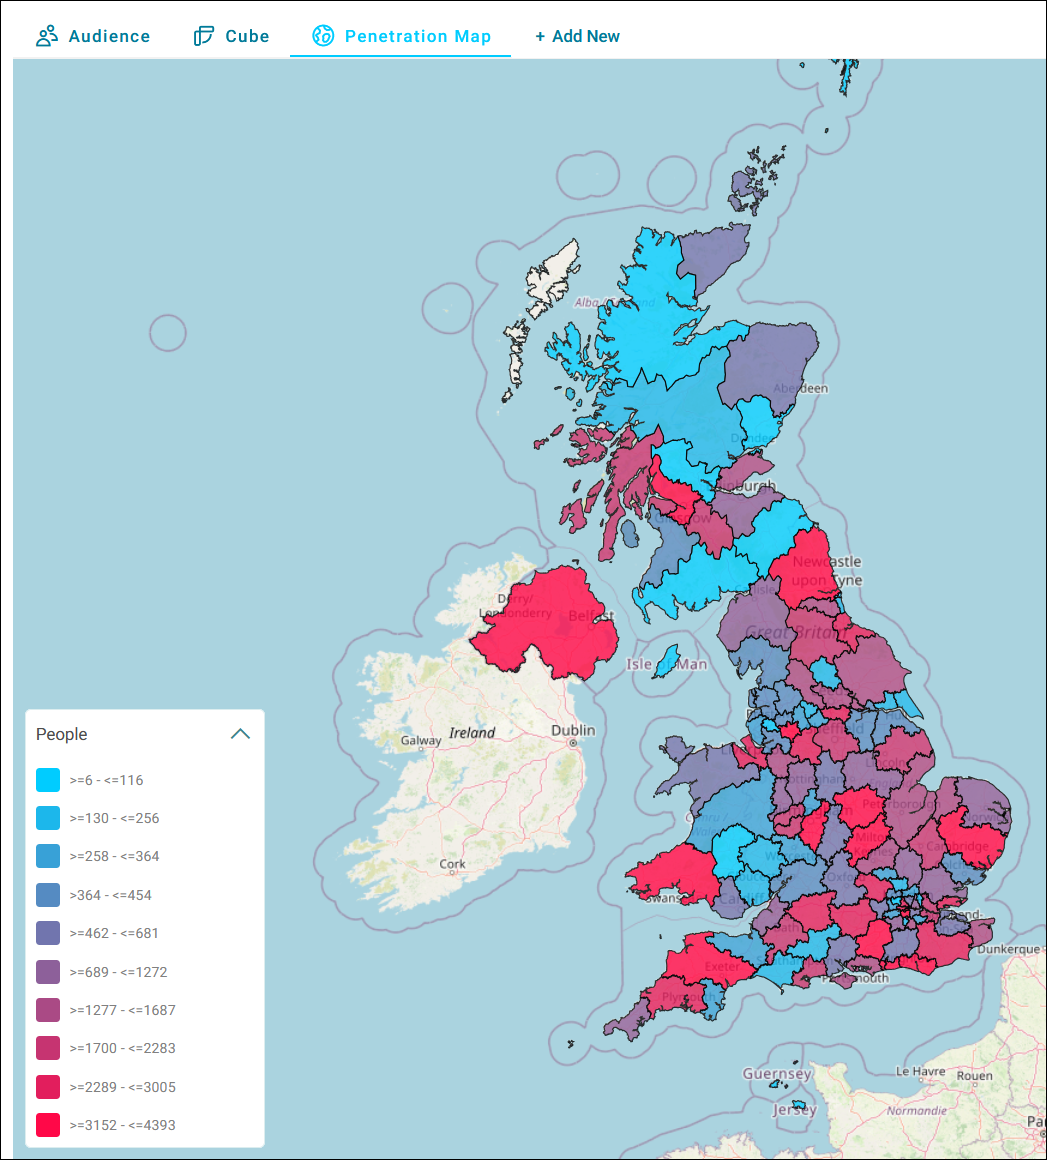
The penetration map shows the concentration of Sweden holidaymakers in each area relative to the base group.
This insight helps marketers focus resources on areas with the highest density of target customers.
Penetration maps help you make data-driven decisions to optimise your marketing strategies.
To create a penetration map:
- Complete the following steps to create Workbook maps.
-
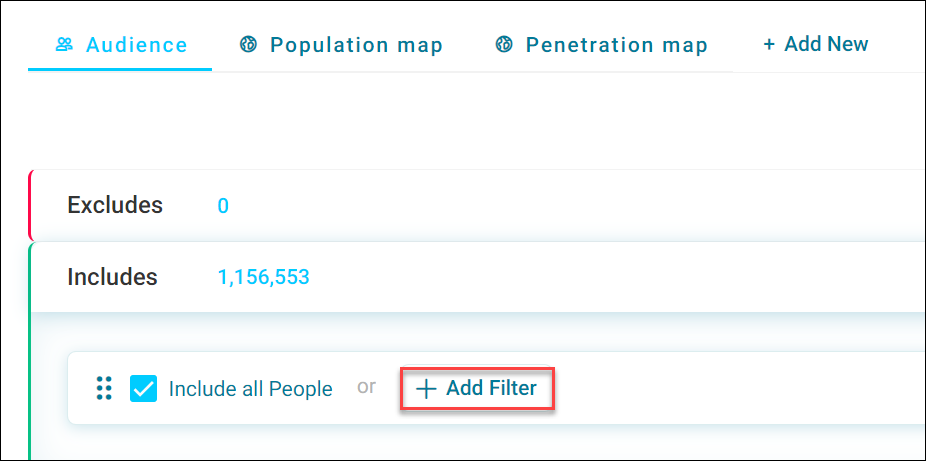
Now, add a filter to your audience. For example, people who have picked Sweden as a booking destination.
-
Select Apply.
-
Select your penetration map.

-
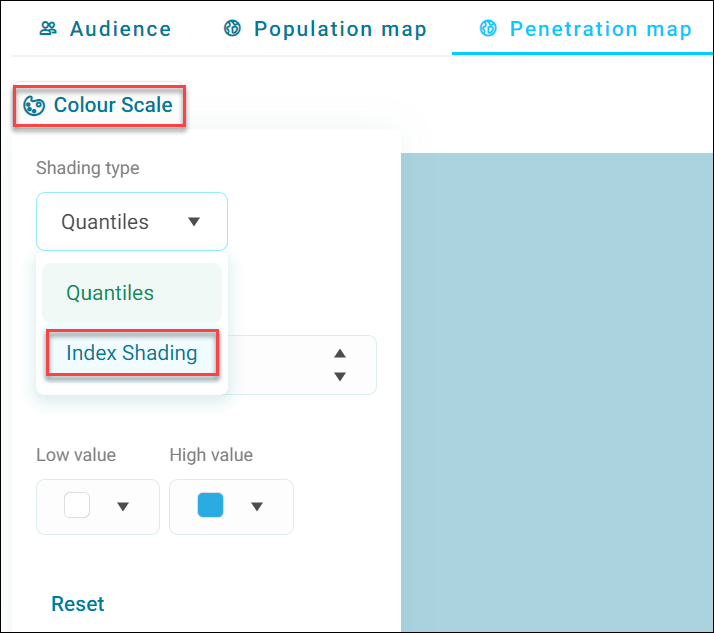
Select Colour Scale and change the Shading type from Quantiles to Index Shading.
-
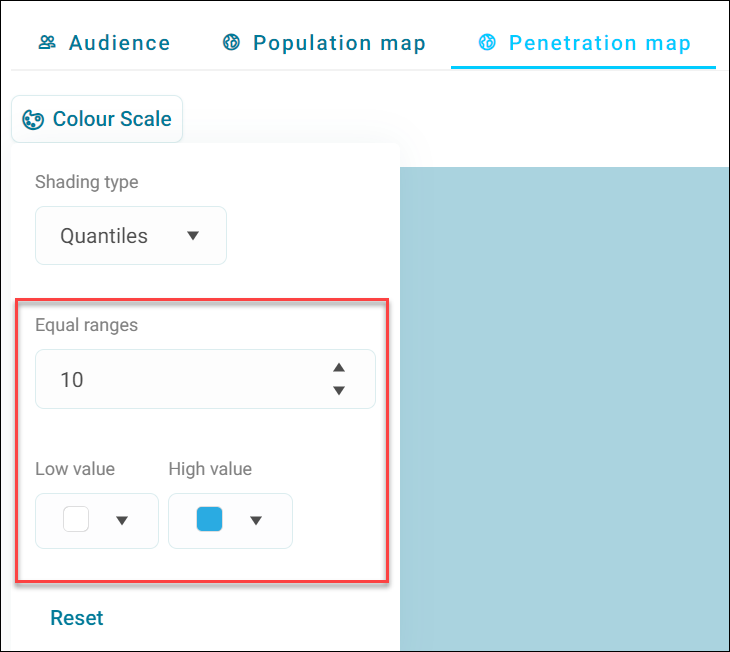
Change the Equal ranges to your preferred unit either side of your index.
-
Adjust your Low value and High value as required.
You've now created your penetration map.
You have an analysis group and a base group. You can see how customers who've booked holidays to Sweden spread across the map, compared to the general population.