Solutions
Solutions are guided ways to add a ready-made page to your audience workbook, for a common task. You find them under Solutions when you select + New Page:
- Check My Results: Check that your audience holds the people you meant to select
- Browse Data: Look through the records in your audience
- Export Data: Set up the records to export to a file, an FTP site, or a channel
- Find Look-alikes: Find more people like the ones in your audience
Check My Results
A Check My Results page shows charts of your audience, and a grid of its records, so you can sense-check it before you use it. It's worth checking an audience whenever you've changed how its filters combine. See Combine filters.
To add a Check My Results page:
- Select + New Page, and name the page. Under Solutions, select Add on Check My Results.
-
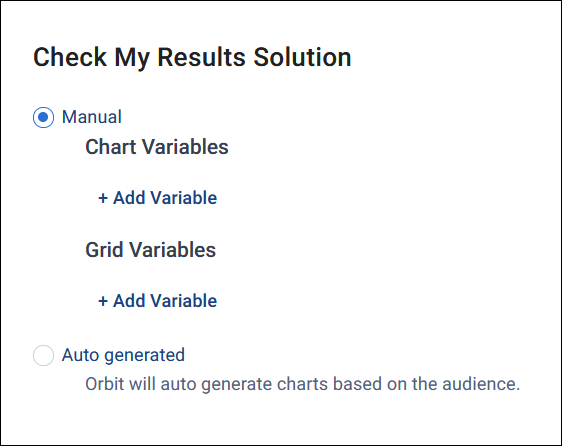
Choose how to build the page:
- Manual: Under Chart Variables, select + Add Variable for each chart you want. Under Grid Variables, add the variables to show as columns in the grid.
- Auto generated: Orbit chooses charts based on the variables in your audience
Orbit chooses each chart's style, such as a donut or column chart, from how many categories its variable has.
-
Select Add.
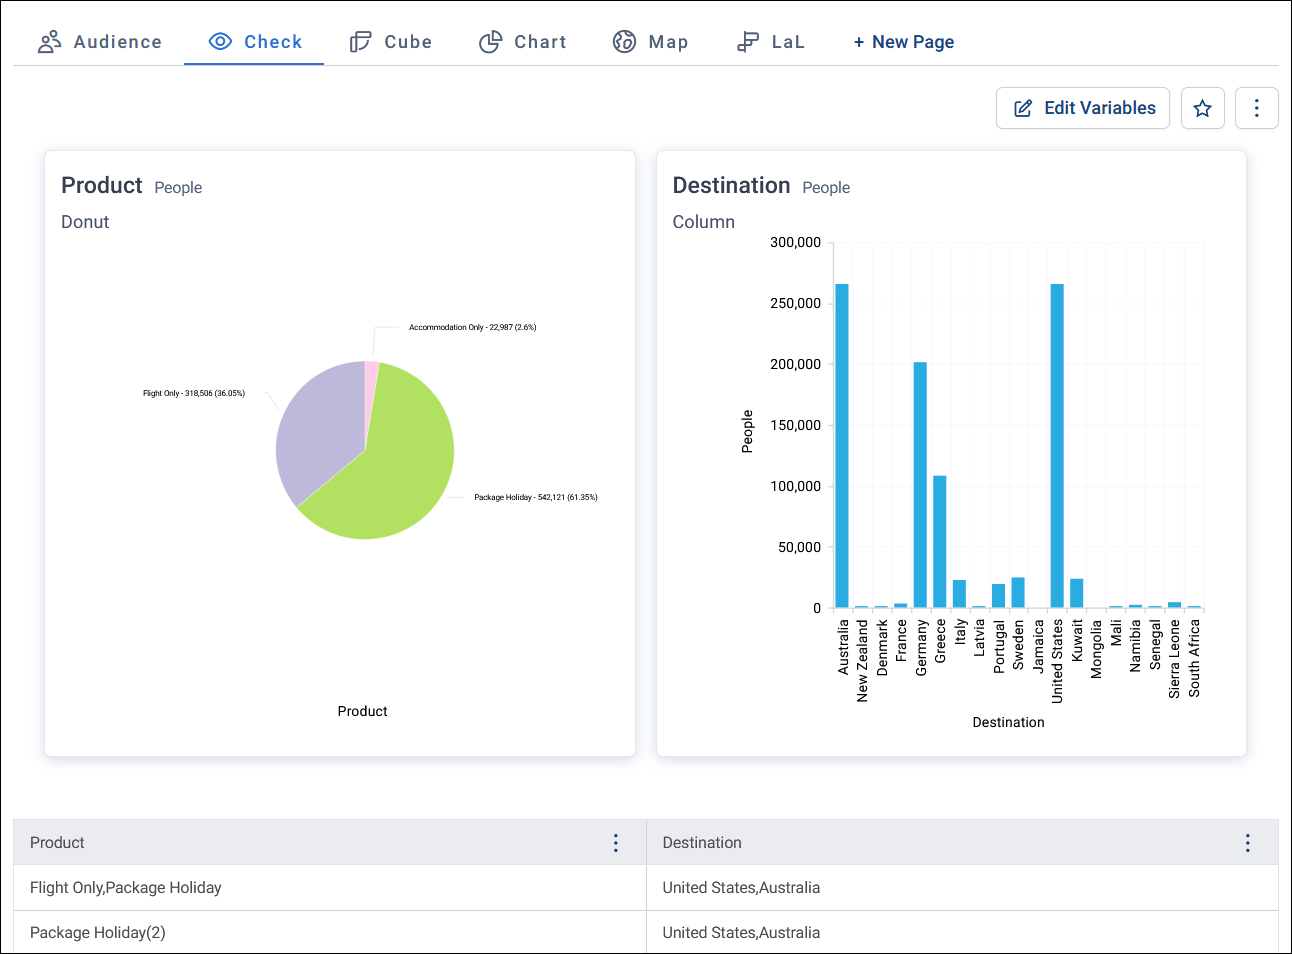
To change the charts or the grid's columns, select Edit Variables.
Example
Your audience leaves out supporters who've asked not to be contacted, and anyone in the same household as them. Add a Check My Results page with a chart of contact permission and a chart of a household-level marketable flag. If either chart shows people who should have been left out, your excludes need fixing. If your system doesn't have a marketable flag, your FastStats system designer can create one.
To use the same checks on other audiences, save the page as a favourite. It then shows under Favourites with an eye icon, ready to add to any audience.
Browse Data
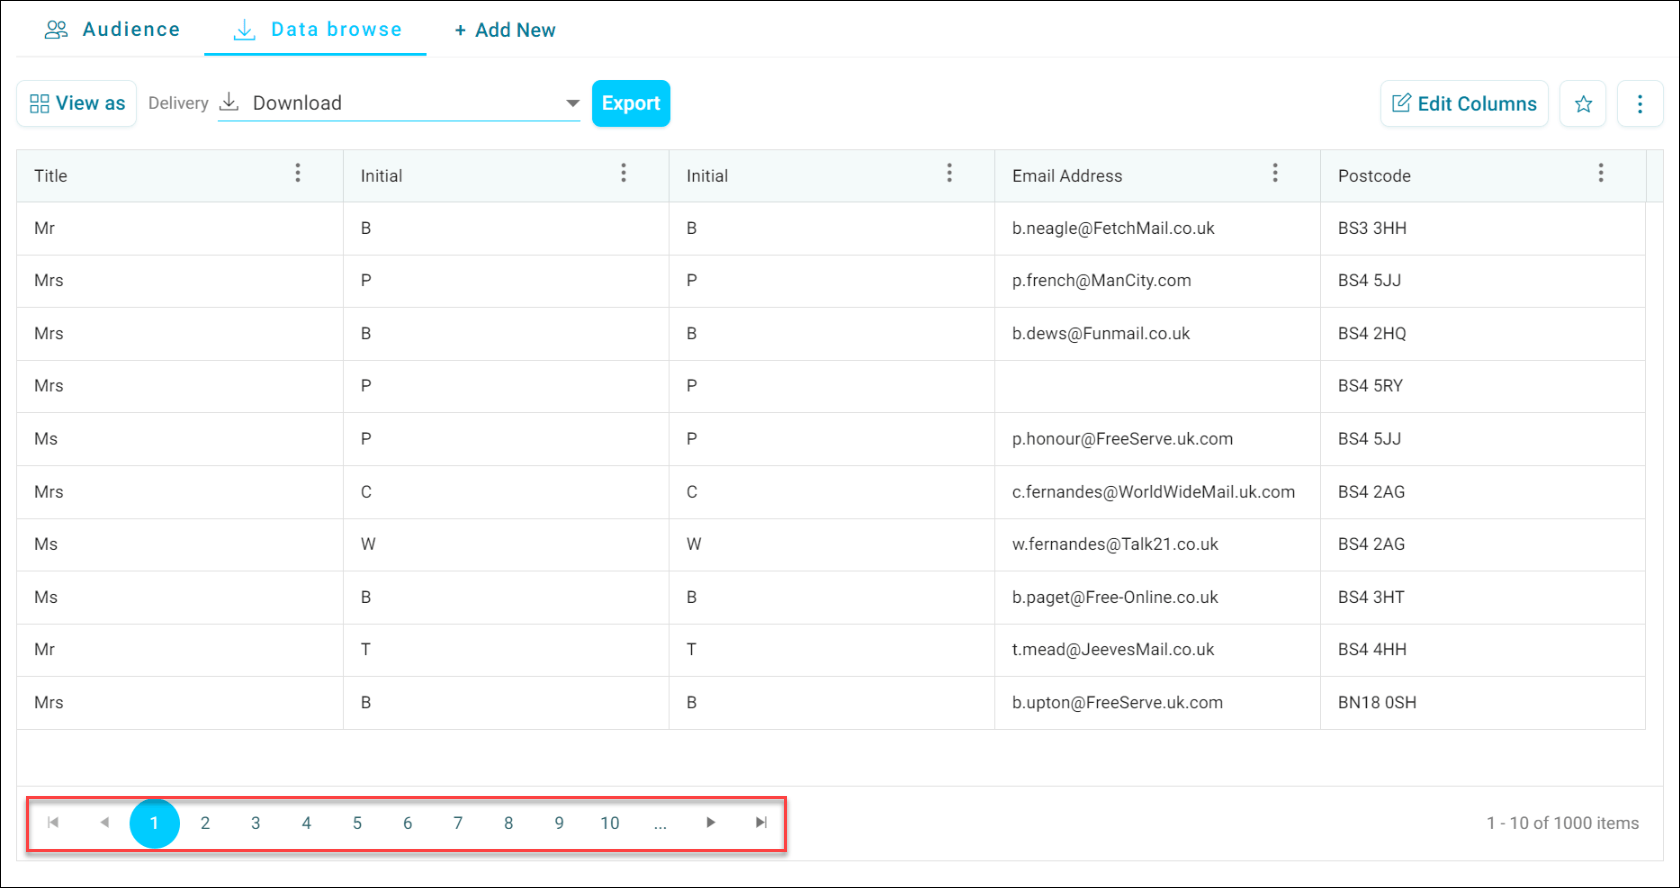
A Browse Data page shows the records in your audience in a data grid, with the columns you choose.
To add a Browse Data page:
- Select + New Page, and name the page. Under Solutions, select Add on Browse Data.
- Choose the variables to show as columns. Drag them in the Columns list to change their order.
- Select Add.
The grid shows the first thousand records. Use the pager at the bottom of the grid to move through them.
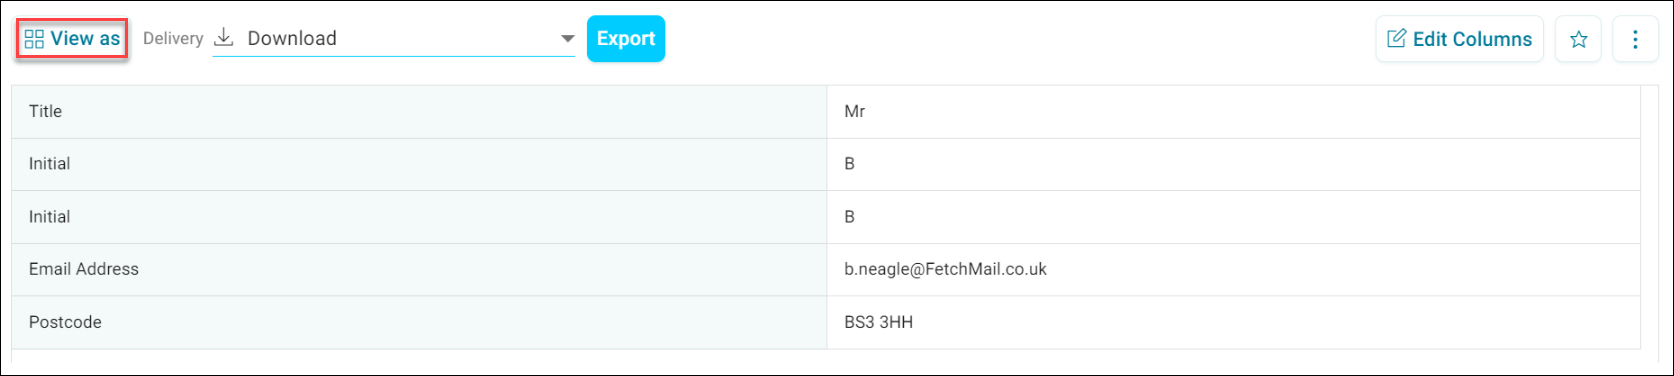
To see one record at a time, select View As in the top right, and switch to Page View.
To add or remove columns later, select Properties.
Tip
A data grid is a good way to check why a record is in your audience. Add the variables from each part of your audience's logic as columns. For any record that seems wrong, its values show which part of the logic it matched.
Sorting and filtering columns
Select a column header's options menu to sort the column, and to filter it if it's a text, numeric, or date column: Contains or Does not contain for text, a comparison such as Is greater than for numbers, or a From and To date range for dates.
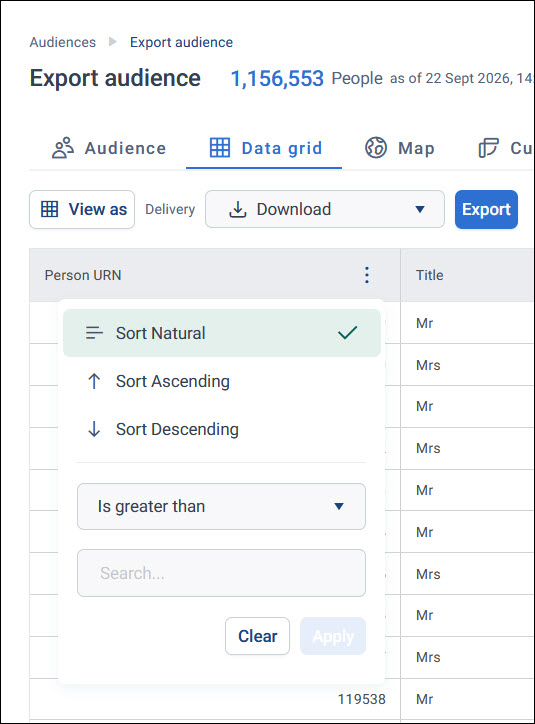
Sorting applies as soon as you select it, or select Sort Natural to reset a column to its default sort order. For a filter, enter your criteria, then select Apply, which stays disabled until you enter a value. Selecting Apply applies the filter and closes the menu. Select Clear to reset the filter. See Data grid tiles for the full set of filter options for each column type.
Export Data
An Export Data page is a data grid set up for exporting: it starts with the table and the columns your export needs.
To add an Export Data page:
- Select + New Page, and name the page. Under Solutions, select Add on Export Data.
-
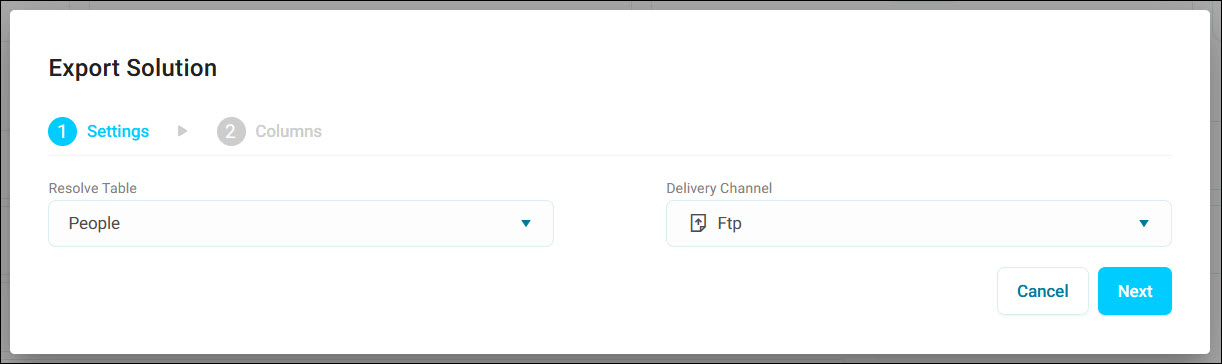
Choose the Resolve Table, the table whose records you want to export, such as People. Then choose the Delivery Channel, and select Next.
-
Choose the columns to export. The channel may need some columns, which you can't remove.
- Select Add. Orbit adds a data grid page to your workbook.
Tip
Different recipients often need different columns, such as names and addresses for a mailing house, but only first names and email addresses for internal testing. Save an Export Data page for each as a favourite, then add the right one to any audience.
To export the records, save your audience, then open the page's options menu and select Export. See Export an audience.