FastStats release notes 2022
Our FastStats development team works using quarterly releases. Scroll down to see the FastStats quarterly releases from 2022.
Note: Please see Notes for administrators for steps to be completed before applying a quarterly upgrade to your Apteco software.
FastStats Q4 2022 software release
New Features
Analysis
Territories wizard: New thematic mapping capabilities
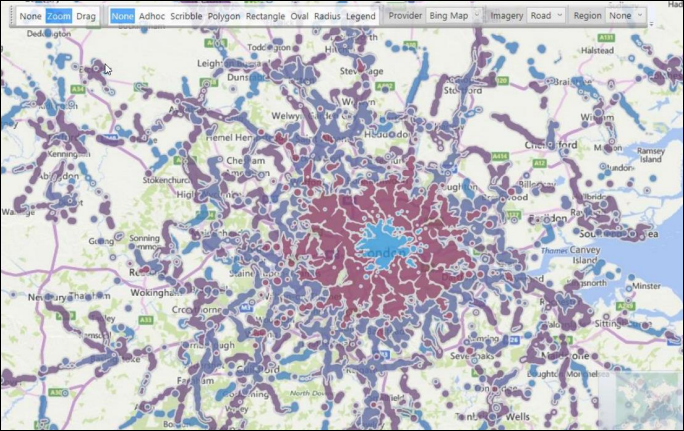
The Territories wizard (previously used with Microsoft MapPoint) has been repurposed to work with Microsoft Bing Maps. This allows you to more easily generate map visualisations that are thematically shaded, either according to the number of people, or another selected metric. Setting up shape files is simpler, and the types of variables you can use extend beyond the typical options of Postal Sector, District and Area to include, for example, political or health region boundaries and even custom territories.
Using the Territories wizard, you have multiple ways of creating virtual variables that are associated with map shape files and used to create the visualisations. Methods include:
-
Creating a virtual variable directly from a geographic shapefile:
Each record is categorised by shape, and a related JSON shapefile is created. This allows you to immediately use the variable to generate shaded maps or record selection.
Note: This method creates an expression to define the population of the categories of the virtual variable.
-
Creating a virtual variable directly from selections made on a map:
You can generate territories defined using the map drawing tools or from drivetime selections.
-
Options for existing virtual variables:
It is possible to link an existing variable to a shapefile, or retrofit to a virtual variable created using the Drive Zone wizard.
See Territories Wizard.
Drive Zone wizard: Thematic option
The Drive Zone wizard now has a new checkbox option which, when selected, allows you to associate the virtual variable with the shapes defined by the drive zone times to create thematic maps of drive zones around a specified location.
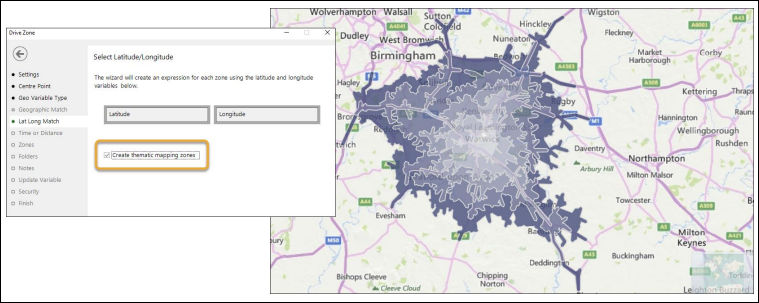
See Drive Zone Wizard.
Bing Isochrone API: Default
The default algorithm for generating drive time selections in the Map tool is now the Bing Driving (Isochrone API). The former Routes API algorithm remains as a Travel Type option in the Drive Time Settings panel for legacy compatibility but is significantly more costly in Bing transactions that the Isochrone method.
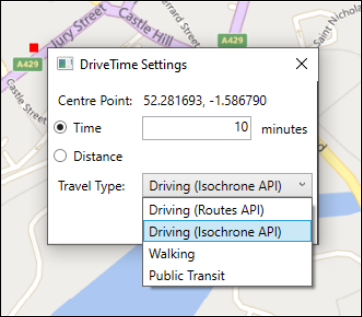
Mapping General
-
For details of how to set up FastStats mapping, see the online Mapping Installation Guide.
-
From Q1 2023 Apteco will no longer support the use of Microsoft MapPoint.
Modelling
Behavioural modelling: Developments
Diverse Features
This release further extends the capability for visualising and identifying a diverse set of predictive features for use in a predictive model. Developments include:
-
Negative Niche Features: Features which only apply to some customers but give a strong indication of being a poor prospect.
-
Insight and Non-insight Categories: All categories of a dimension are now described as either ‘insight categories’ or ‘non-insight categories’. The latter refers if the Z-score is non-significant with an absolute value below 3.0, or the PWE score is too small with an absolute value below 0.1.
-
Insight PWE: To supersede Uplift PWE (which only included positive PWE values) and provide a measure of the predictive strength of a dimension over those categories where a sizeable and significant prediction can be made (the ‘insight categories'). Insight PWE is the mean absolute PWE over just these categories, weighted by the number of people in each category.
-
Insight Coverage: Provides an indication of the number of people for whom a dimension can give a significant and sizable prediction. This can be expressed as a simple count or as a percentage of the total number of people in the Base selection.
-
Insight Type: All features are now assigned an insight type based on the nature of the insight they provide:
-
Positive features: Where the insight categories predominantly have a positive Predictive Weight of Evidence (PWE)
-
Negative features: Where the insight categories predominantly have a negative PWE
-
Balanced features: Where the insight categories provide a balance of positive and negative insight
-
No insight: Where there are no categories with a significant or sizeable PWE
-
-
The definitions use an 80:20 cut-off to categorise dimensions. If the balance of positive/negative insight categories is less extreme than 80:20 based on coverage, then the feature is classed as balanced.
-
The Insight definitions described and used for behavioural modelling are based on training data alone. This is a change from the previous release when evaluation data was used in some parts and enables full support for insight measures and charts in standard modelling (see below).
Dimensions list
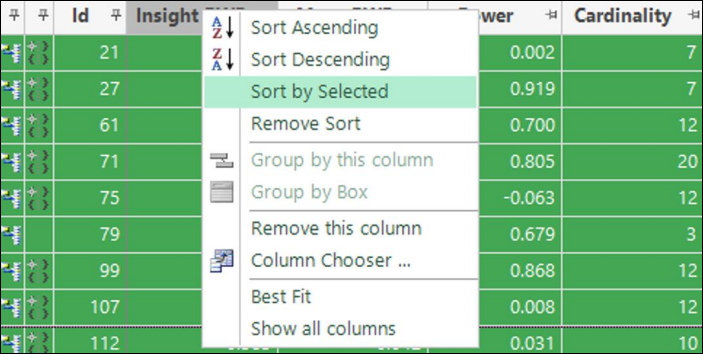
You can view Insight Type, Insight Coverage, and Insight PWE as columns in the Dimensions list.
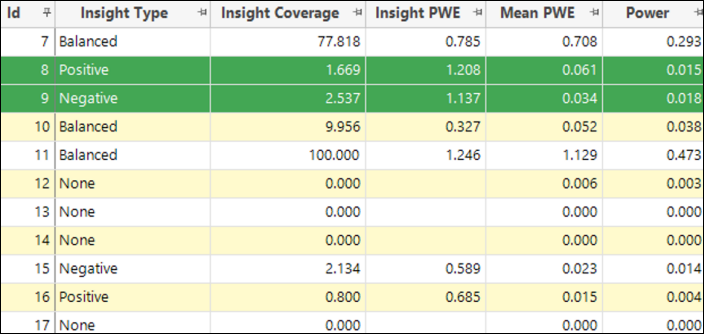
You can also sort dimensions based on whether they are selected. This can be helpful for aligning the cells in the Association Matrix which automatically follow the same
sort order.
Further chart options
The chart options dialog, launched using the ellipsis ‘…’ button, provides additional flexibility for the appearance of charts, including:
-
The option to hide as well as show dimensions
-
Control of dimension visibility in terms of tags, selected, and used status
-
New options for how points are coloured, including Insight Type
Association Matrix options
The matrix now supports the same show/hide controls as the dimension charts.
See Q4 2022 Modelling Development Update.
Standard modelling: Support for insight measures and charts
The concepts, charts, and measures described for behavioural modelling are also fully supported for standard modelling. However, since there is no concept of ‘evaluation’ in standard modelling, insight definitions are now based on training data alone.
Note: The Agreement PWE chart is not available in standard modelling as this chart is used to compare the training and evaluation timepoints.
See Q4 2022 Standard Modelling Development Update.
Modelling: Performance improvements
The processing of dimension results is now parallelized and sequenced to improve performance. The three main stages are:
-
Caching the base and analysis selections: Used in the profiling of all dimensions
-
Evaluating the Point-in-Time expression: Each person’s event timepoint to aggregate their behaviour
-
Running the profiles for each dimension: In batches of 10 by default
See Modelling – Parallel Running of Dimensions.
Expressions
New CreateTextList expression function
A new CreateTextList function has been added. This allows you to create a text list from text values, text variables, or other text lists.
See Expressions: List functions.
Updated Index expression function
The Index function has been extended to take text list parameters.
FastStats bug fixes
| Feature | Description |
|---|---|
| Export | Fixed an issue preventing exports in UTF8 systems from sorting correctly. |
| Expressions | Fixed a Pattern Match aggregation dialogs appearance issue in German language translations. |
| Modelling | Fixed an issue causing a system crash when opening up the R integration without any settings from the Modelling Environment. |
FastStats Q3 2022 software release
New Features
Analysis
Significant improvements in the Point to Point wizard capability
Identifying the nearest branch or store by a drive time measure has been useful for many businesses but, historically, has presented multiple challenges in terms of calculating precise results in a timely manner. For systems that have latitude and longitude variables marked with the 'geoformat' property, use of the new Bing lsochrone API means the Point to Point wizard can now calculate zones for larger volumes of records, efficiently, and with a user-specified level of accuracy. When specifying multiple centre points, you can select from several result type options and create a virtual variable for each centre point with the same parameters. A new option to specify 'Walking Time' is also available.
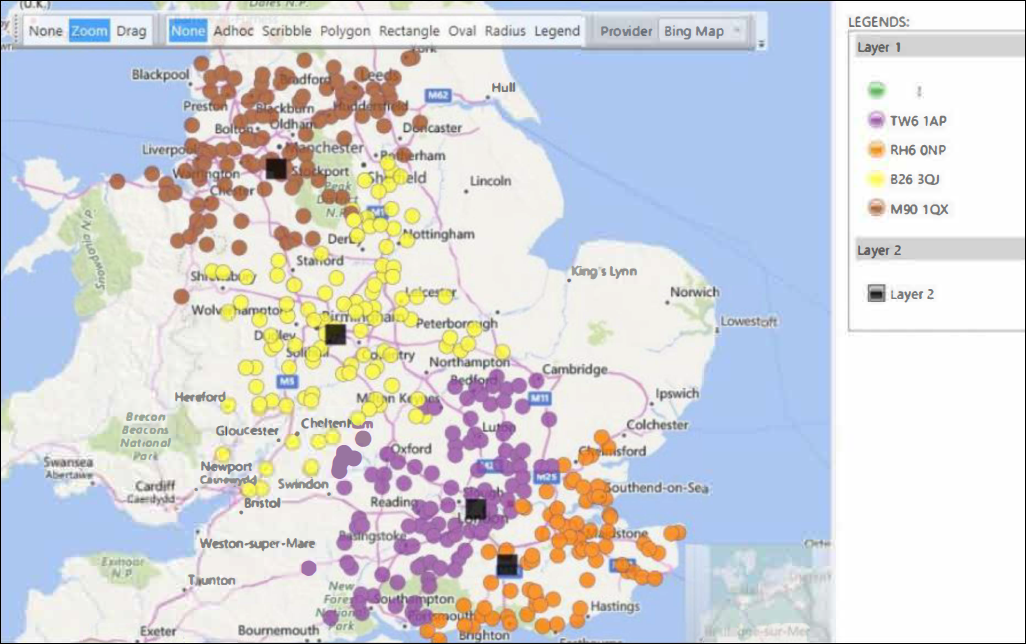
In the above example, colours are used to indicate which of the four indicated airports is a person's nearest. Notice that, whilst some people might be geographically closer to one airport, the drivetime calculation returns that they can drive to another more quickly.
Drive Zone wizard performance improvements
By default, the Drive Zone wizard now uses the Bing lsochrone API to calculate zones more quickly and with greater accuracy. Actual performance increases are determined by factors including the number of centre points, number and size of zones, and the number of records in the system, but you can expect to see approximately ten times the number of vertices on the drivetime shape, with results returned up to twenty times faster. A new option to specify 'Walking Time' is also available.
See Drive Zone Wizard.
New billable transactions for Bing Maps
To provide new functionality for geographic mapping functions, we now use billable Bing transactions. Each licensed user is credited with 6600 transactions per year, sufficient for most normal use. For example, the initial calculation using a Drive Zone wizard request for 10 centre points each with 5 zones would result in 50 billable transactions. Subsequent data refreshes would be free.
From your next renewal, additional transactions required will be supplied at l.5p each. To protect users from unintentional spend on billable Bing transactions, we have added warning messages and maximum volume checks in the three geographic wizards: Location Geocoder, Drive Zone, and Point to Point.
Modelling
Using measures of association to find diverse dimensions
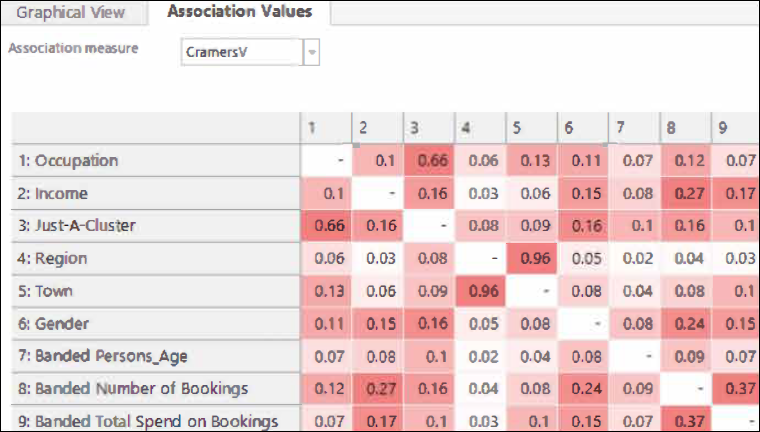
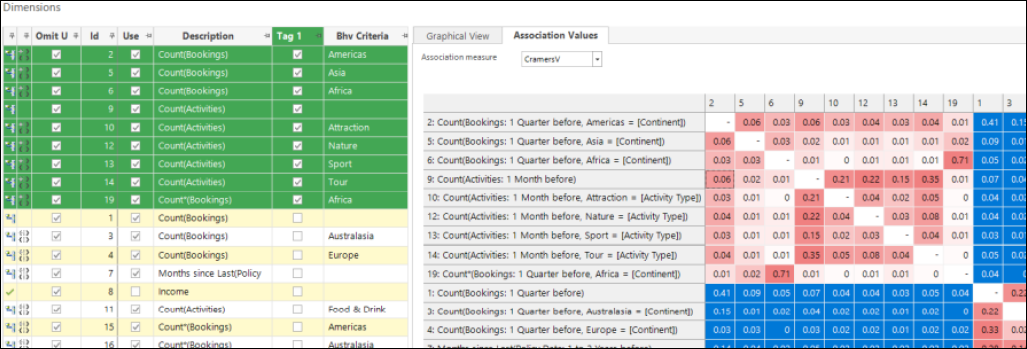
The Dimensions tab in the Modelling Environment allows you to explore and identify features which are most useful in creating a model. Selected dimensions should either be predictive (those which can distinguish between the analysis and base selections) or diverse (those which are not related to each other). This latest development allows you to focus on finding diverse dimensions by using various methods of 'association' and can be used in both standard and behavioural modelling. You can now use the Association Values tab to view alternative measures of the degree of similarity between dimensions for standard and behavioural features, and any other banded numeric or expression.
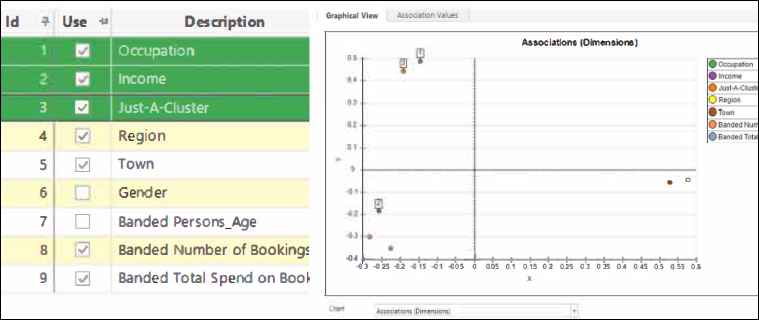
The Graphical View tab allows you to visualise how dimensions are interrelated.
See Using Measures of Association to find Diverse Dimensions.
Improved organisation of behavioural features New functionality within the Modelling Environment helps you to explore, organise and manage multiple dimensions by a process of selecting and tagging them. You can select dimensions across each of the views (chart, association grid, main list grid) and, once highlighted, amend them from the other views. Tagging dimensions allows you to make a more permanent record of a selection of dimensions that you wish to investigate further.
See Selecting and Tagging Dimensions.
Modelling Environment enhancements
The latest developments in this release include:
• Improvements to chart zoom and reset zoom capability
• Incomplete chart results information dialogue box which prompts for corrective action
• Ability to explicitly delete results for a particular dimension
• The build control button now detects when either the standard profile results or the new association values need building. You have the option to build each type of result separately.
• If a behavioural feature becomes invalid, a validation reason is displayed in the user interface
Expressions
Extensions to Pattern Match aggregation capability
We have built on the existing capability to offer greater flexibility and allow previously unachievable analysis, particularly in scenarios where wildcards are used, or to find out when particular patterns happened.
You can specify an include or exclude list of codes from the pattern variable, representing either the only ones of interest (include list), or those you do not want to see (exclude list).
See Aggregations on the fly – Pattern Match Include or Exclude List.
In addition to returning information about the first and last elements of a pattern, you can now also return an intermediate, Nth element of a pattern in terms of transaction number, order value, or item value.
See Aggregations on the fly – Pattern Match Return Value on Transactional Table.
New expression function
A new LogN function has been added which takes the logarithm of the number to the given base.
Updated expression function
In Location Functions, the GeoPointInArea expression benefits from a significant increase in speed. Its first two parameters can be variables, but all other parameters must be fixed numeric values.
FastStats bug fixes
| Feature | Description |
|---|---|
| Selection | In TopN sampling, the count column in the sequenced codes dialog is slightly too small to see the counts. |
| Wizards | Aggregation wizard allows drop of text/reference variable but is then unable to proceed. In the Drive Zone wizard, an incorrect message relating to multiple centre points displays on the variable creation screen. German wizards had some choice controls in bold and some not. |
| Virtual Variables | Issue of variable descriptions (not references) ending up in the virtual variable xml when a saved expression is dragged into a selection. Issue of variable descriptions (not references) ending up in the virtual variable xml when a saved selection contains an expression that has been dragged in. |
| Map | Drive Time settings dialog is not translated. Map search settings dialog is not translated. Rectangle tool from map can create wrong selections. |
| Expressions | An expression with two pattern match aggregations with different patterns or include/exclude lists will not work. |
FastStats Q2 2022 software release
New Features
Analysis
Extended DriveTime calculation options in Map tool
Drivetime capability in the Map tool has been extended so that you can choose to calculate drivetimes using the Bing Isochrone API. With no fixed number of endpoints, the new method can return more complex shapes and, consequently, more accurate results, often more quickly. Travel types also include options for walking and public transport.
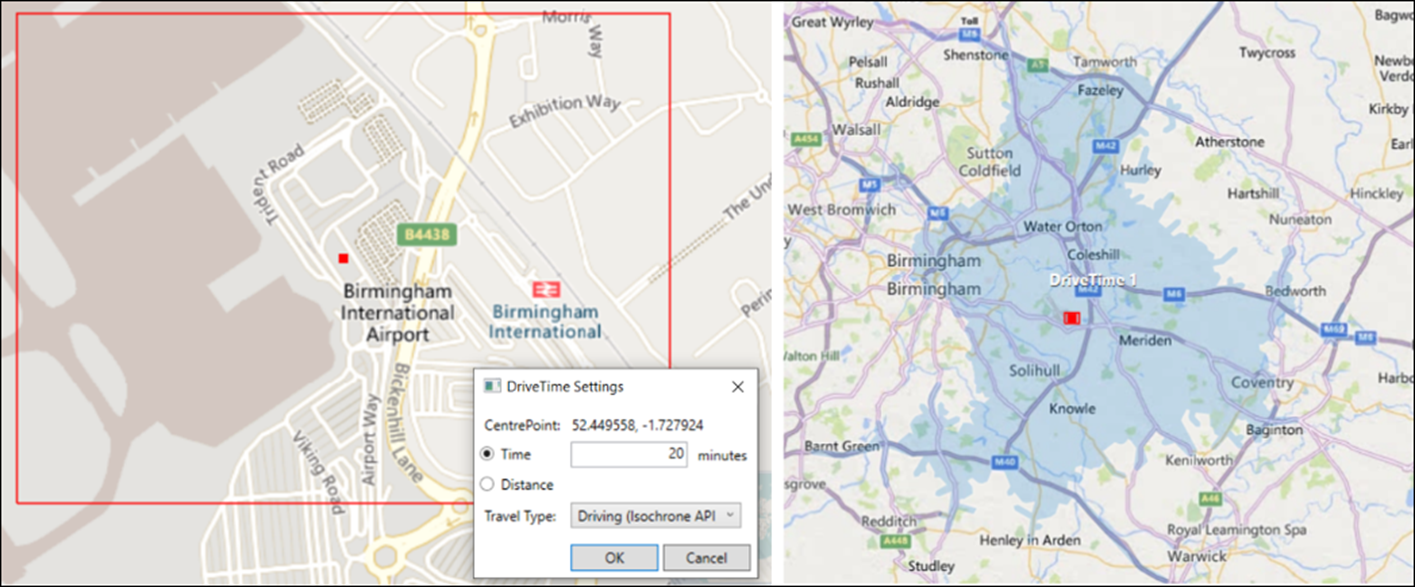
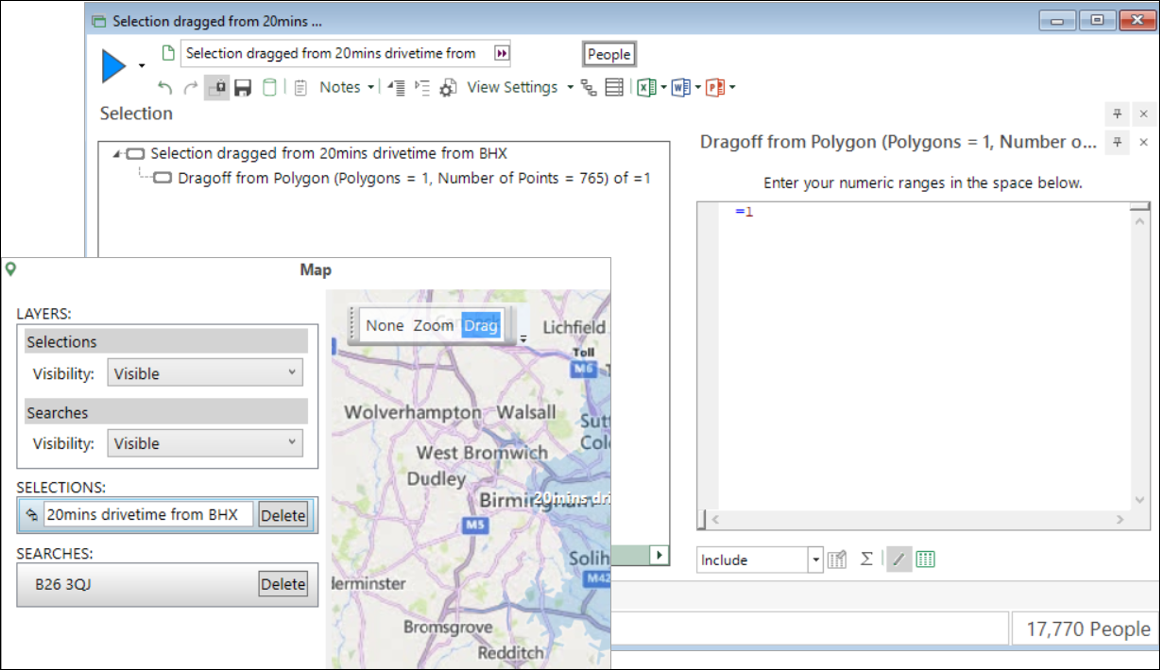
You can drag from the map to create a FastStats selection of the records identified by your isochrone drivetime calculation. This generates a selection on an expression containing all the vertices of the precise drivetime shape. Consequently, the selection may evaluate more slowly than the simpler shapes generated by the previous (Routes API) method.
See Bing Maps: DriveTime Calculations help.
New Date/DateTime bandings on Cubes
When creating cube dimensions using a date or datetime variable, there are four new banding options available via the right-click context menu. You can use Day of month with both variable types, whilst Hour and Minute, Minute of Hour and Second of Minute are for use in datetime analysis.
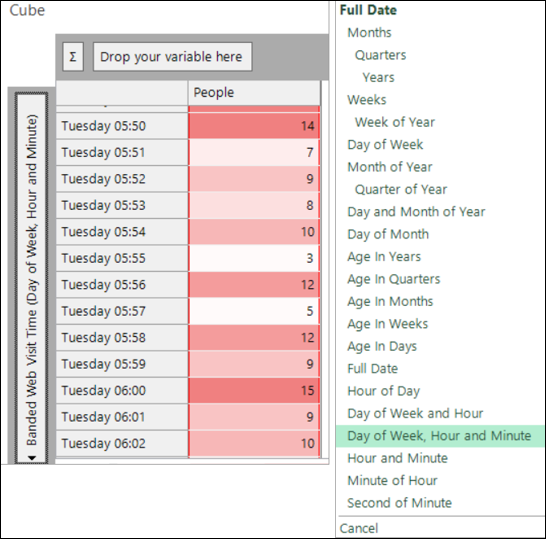
See Cube: How do I create a Cude dimension with Date or DateTime variables help.
Behavioural Modelling
Identifying best Behavioural Features to use in a model
Development in recent releases has made it simpler to generate alternative possible behavioural features; this release makes it easier to identify and select the best features to use in a data model. A selection of new charts, with a combined Training & Evaluation option, allow you to compare training and evaluation periods simultaneously. A new metric – Uplift PWE – provides an alternative to the Power metric and allows you to investigate niche features which may only apply to a small subset of your customer base, but still provide a strong indication of a good prospect.

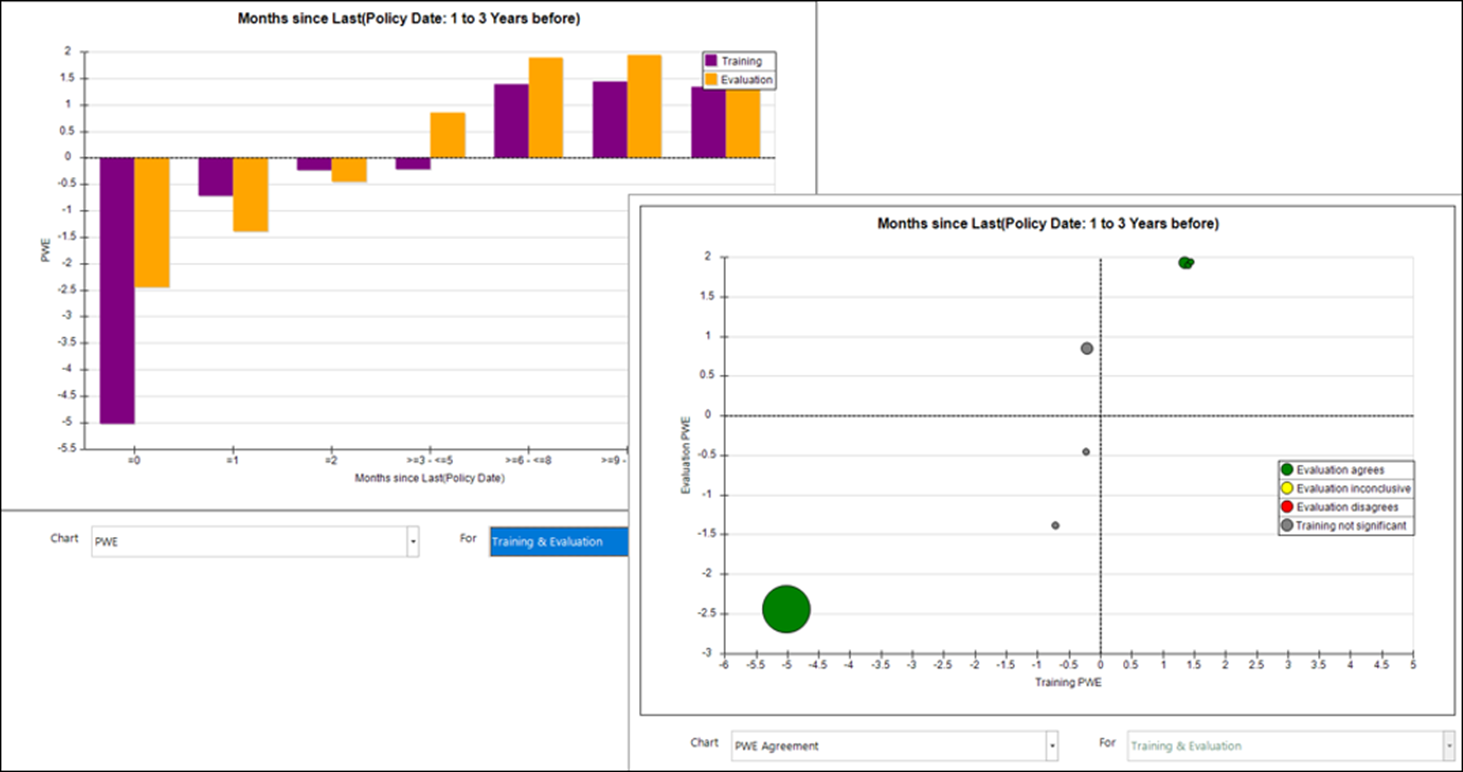
See Identifying the best Behavioural Features to use in a model help.
Expressions
Introduction of Regular Expressions with new String expression functions
Regular expressions (Regex) and five new string functions complement and bring additional power to existing FastStats sting capability when creating string selections.
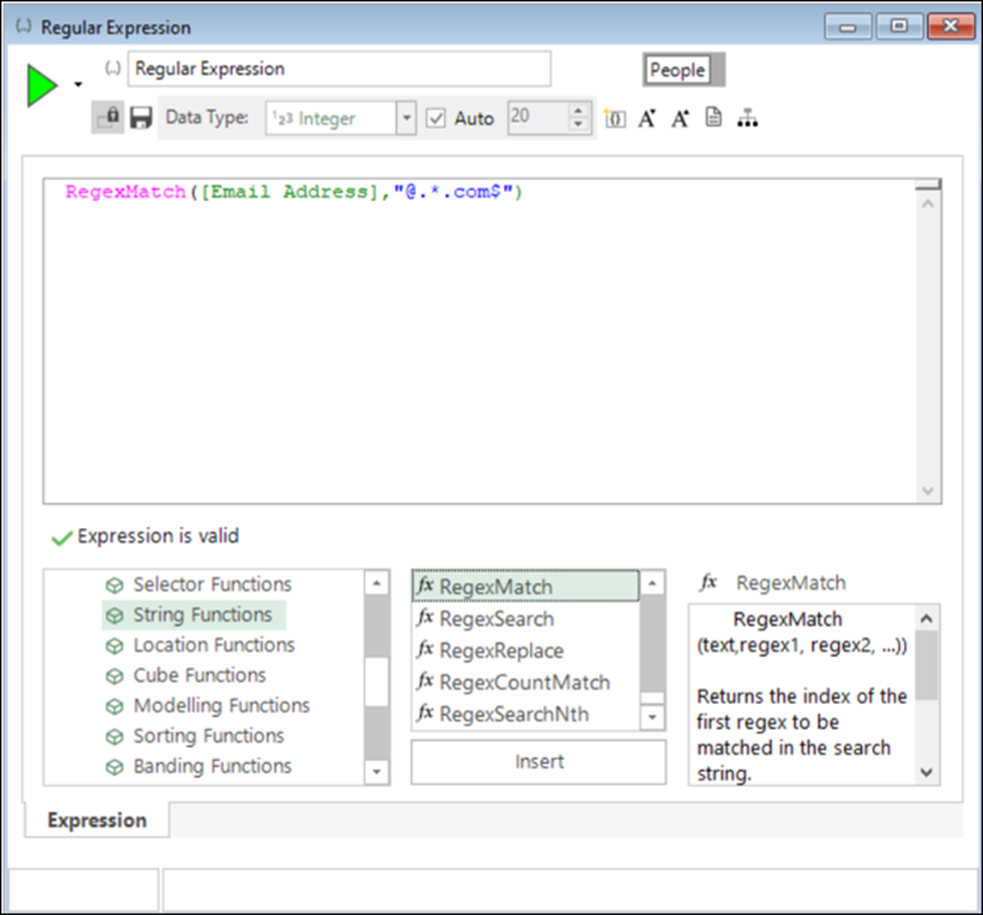
See Regular Expressions (Regex) support in String expression help.
Add Date/DateTime expressions as a Cube dimension
You can now drag and drop a date or datetime expression directly onto a cube as a dimension without first needing to create a virtual variable. You can then band the expression using any of the right-click options available for date and datetime variables and use the new dimension type in all the same ways as a banded date or datetime variable.
See Cube: How do I create a Cube dimension with a Date or DateTime Expression? help.
New Date and Time Expression functions
Two new Date functions are available:
• IsWeekday
• IsWeekend
See Expression: Date Functions help.
The Date Conversion function - FormatDate - can support time elements, such as hour/minute/second, when converting a DateTime variable to its string representation.
See Expression: Date Conversion Functions help.
FastStats bug fixes
| Feature | Description |
|---|---|
| Cube | Numeric banded dimension cubes do not show results when reloaded. |
| Too many categories on datetime, fully banded cube. | |
| Selection | For a parameterised selection, Always Clear and Ask and Date Range return incorrect results. |
| Scheduled Task | A scheduled task can error if scheduled between 01:00 and 02:00 on the day the clocks move forward, causing other due scheduled tasks to be repeatedly added to the job queue. |
| Wizards | From Q2 2022, creating a new DriveZone virtual variable with latitude/longitude does not correctly place the variable into the System folder until a system reset is carried out. |
| Expressions | Issue of the category type property always being ascending when converting an expression to a selector type virtual variable. |
| NthIndex expression function gives wrong results when containing missing value parameters. | |
| NthIndex expression function can give incorrect results with only one non-missing value. | |
| TimeHour/TimeMinute/TimeSecond returns 0 when input value is missing. |
FastStats Q1 2022 software release
New Features
Analysis
Segmentation Migration Extensions
The segmentation migration reports have now been reworked to include new options that summarise movements between segments. Segment movements may be summarised as the following simple to understand marketing concepts: Acquired, Upgraded, Stay the Same, Downgraded, or Lapsed in a particular period. This can be extended to show the number of segments moved in a more granular segmentation scheme. Either report may also now show the value associated with the customers who have migrated segments.
This new addition to the segmentation tool makes reporting and insight both easier to present and more powerful for analysts, marketers, managers, and their teams.

See Segmentation Migrations help.
Behavioural Modelling
Selection, Dimensions, and Results Annotation Improvements
It is now possible to edit the description and add notes associated with selections, dimensions and results. This enables you to better document your findings and thought processes when exploring and comparing data models.

See Behavioural Modelling help.
Data Grid Flexibility
A data grid can be used to display values of behavioural features and event time points for individual people. There is now the option to display the values associated with either the training or evaluation contexts.

You can also choose whether to display the values used in features which involve
Calculations, for example, when showing the difference between two timeframes.
Labelling Improvements
The automatic bands for the ‘time since’ behavioural feature have been adjusted for greater clarity.
The wording on the ‘Modify time frame’ dialogue has also been improved to clarify the interval created.
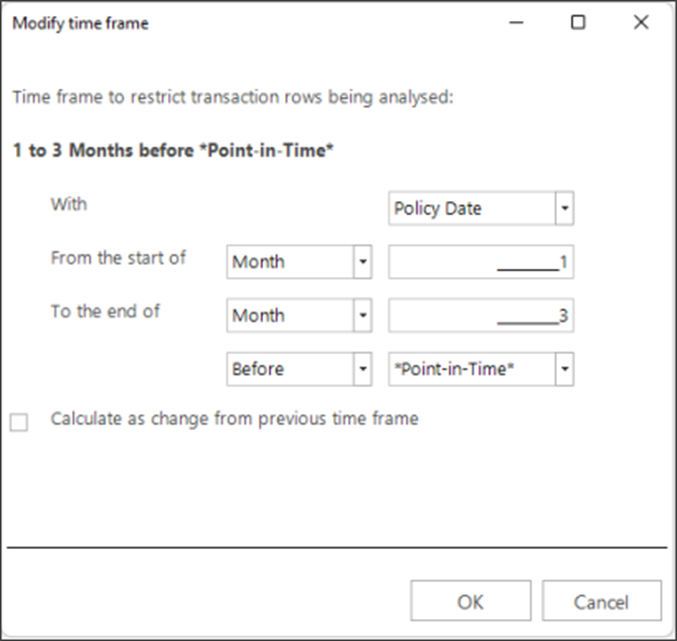
Improved Context Evaluation
The default approach used when evaluating behavioural features has been changed to provide a stronger indication of the effectiveness of predicting behaviour during the evaluation stage.
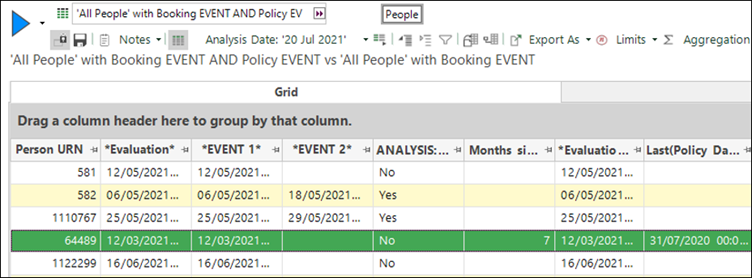
Evaluation now examines behaviour up to the exact date of the base event - for example booking date - rather than using a fixed evaluation date. This better mirrors the behaviour used in creating the features at the training stage of the process.
See Behavioural Modelling help.
Decision Tree Integration Improvements
The results tab of the modelling environment is used to capture and list models that have been generated using dimensions explored within the modelling environment. Previously this has only been possible for decision trees that are built without any manual intervention, that is, by simply clicking the build button.

The modelling environment now captures decision trees which are built and modified using the manual options within the decision tree, such as growing or pruning individual branches.
Decision Tree Performance Improvements
The behavioural features created within the modelling environment make extensive use of cached variables and expressions, often nesting these several levels deep within selections. The long-standing mechanisms used within FastStats for creating requests and evaluating the cache have been updated to cope with this. These changes have been patched back to Q4 2021.
These improvements benefit many areas of FastStats but are particularly noticeable when using decision trees with behavioural features.
Expressions
New Expression Function
The VarCountsInfoFind system function returns the index of the code or description to find for the given variable.
See Expressions help.
Wizards
Drive Zone Wizard Improvements
Two improvements have been made to the Drive Zone wizard:
-
Zones can now be created using Latitude and Longitude variables for all 3 methods of calculating the zone size, resulting in better accuracy.
-
An option for using driving distance for creating the zones has been added.
See Drive Zone Wizard help.
Point to Point Wizard Improvements
Two improvements have been made to the Point to Point wizard:
-
The straight line distance option has been changed so that you can specify Latitude and Longitude variables which are used to calculate the distance from the centre point to each location.
-
For all the existing and new options, you can specify a maximum value of drive time/drive distance/straight line distance, and only records within that area are categorised in the resulting virtual variable.
See Point to Point Wizard help.
FastStats bug fixes
| Feature | Description |
|---|---|
| Behavioural Modelling | Renaming of analysis and base selections being ignored. |
| When the analysis/base scenario is edited, and the only change made was to the descriptions, previously this change was not committed. | |
| Model report doesn't save the evaluation date. | |
| Previously the model report would reopen with the evaluation date reset. | |
| Event times on data grid not always fully populated. | |
| When a data grid was used to view details of behavioural features the values in the columns for “*Event 1*” and “*Event 2*” were sometimes incorrectly left unpopulated. | |
| Segmentation | Segmentation Migration Extensions - OOR Exception when reordering Segments |
| Expressions | Caching issue with AgeHours/Minutes/Seconds expressions in selection |
| More general caching issue with Date and DateTime expressions in selections | |
| Can't use more than 1 VarValueText() function in an expression on a different variable |