Analyse look-alikes
Analyse Look-alikes scores everyone in your data by how closely they match your audience, with no size limit. Use it to decide how many look-alikes to target, and to understand them, before you create a look-alikes audience.
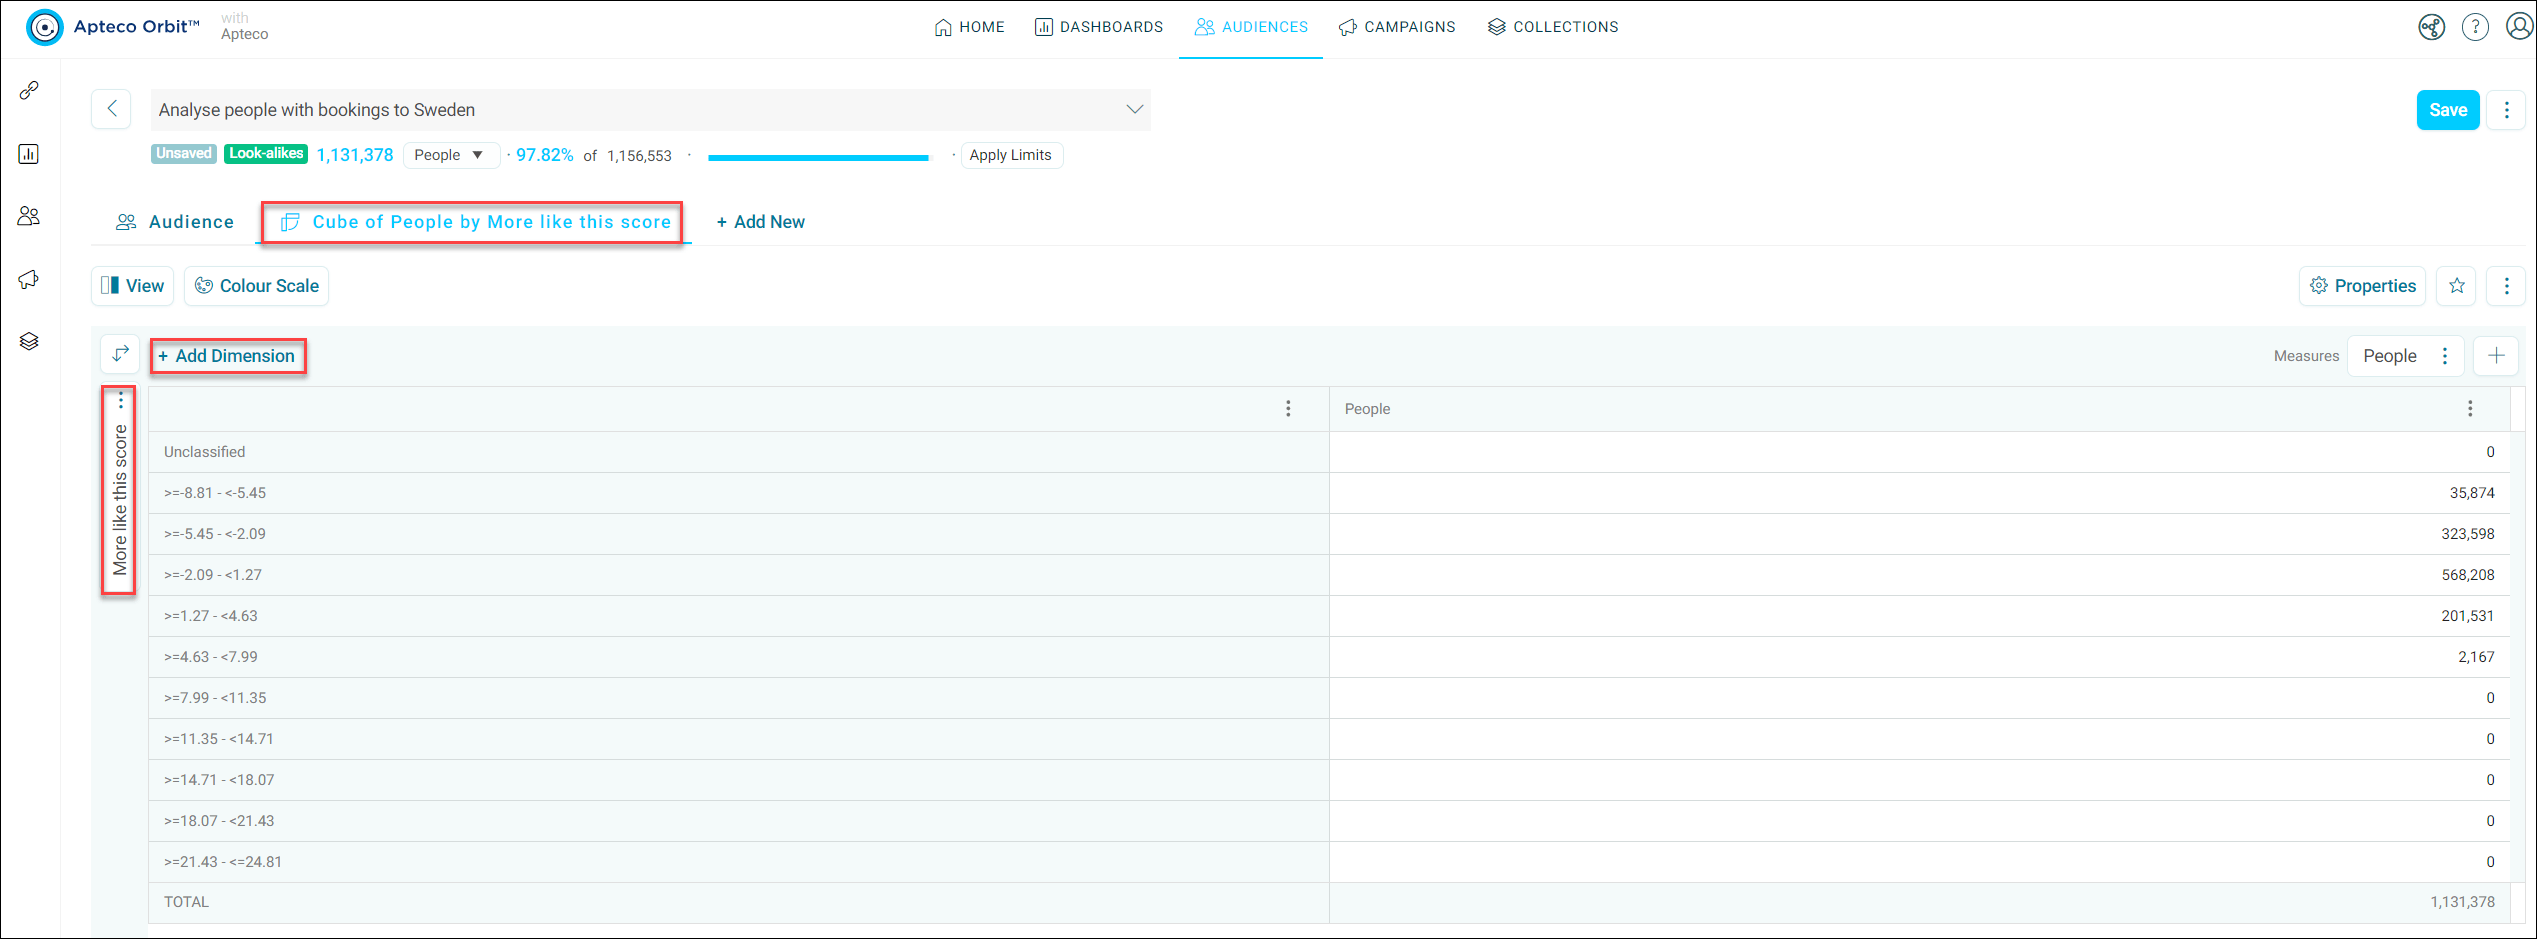
Orbit puts everyone's scores in a new audience, with a cube that shows how many people fall into each band of scores. Add another dimension to the cube to see how the scores vary, for example by region.
Before you begin
First, find what sets your audience apart, and choose the variables to use.
Analyse your look-alikes
To analyse your look-alikes:
-
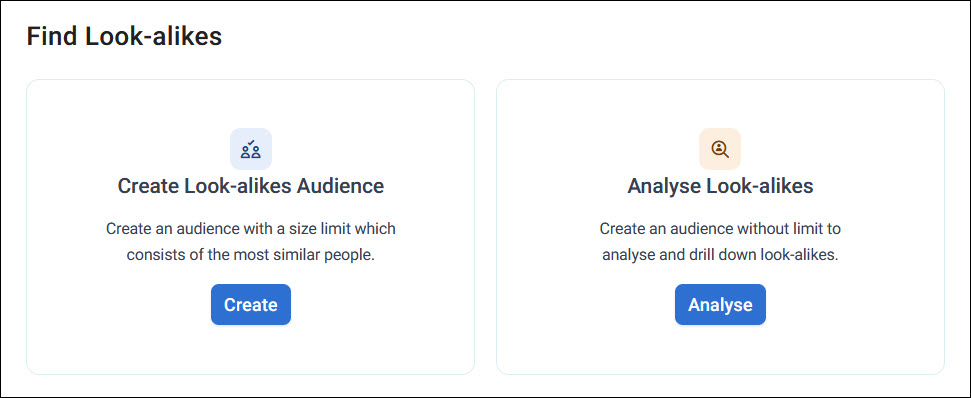
On your Find Look-alikes page, select Find Look-alikes, then select Analyse on Analyse Look-alikes.
-
Enter an Audience Name, check the Look-alikes Score Name, and select Create.
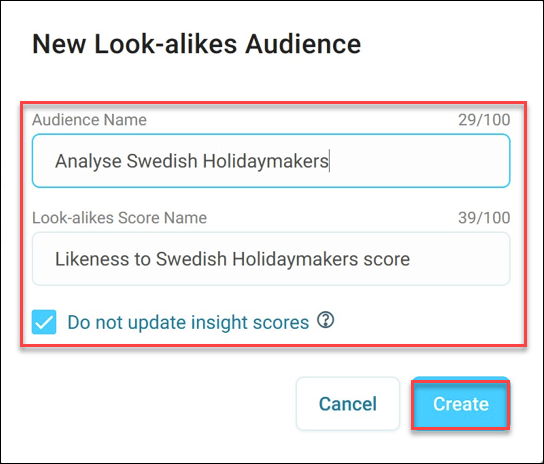
Orbit creates the analysis in the background, and notifies you when it's ready. Select the notification to open it.
The new audience opens on a cube page, with the banded score as its dimension. Select + Add Dimension to break the scores down further.
Note
You can't save this cube as a favourite, because its score dimension belongs to this audience only.
See each person's score
To see each person's score, add the score to a data grid:
- Select + New Page, and name the page. Under Solutions, select Add on Browse Data.
- Choose your columns, including the score variable.
- Select Add.
The higher a person's score, the more closely they match your original audience. For more about cubes and data grids in a workbook, see Cubes and Solutions.