Cubes
A cube page cross-tabulates your audience's records: its dimensions split the records into rows and columns, and its measures fill the cells. It works in the same way as a cube tile on a dashboard. This page covers what's different in a workbook.
Add a cube page
You choose a cube's dimensions and measures in the page's Properties panel.
To add a cube page:
- Select + New Page, and name the page.
- Under Tools, select Cube.
-
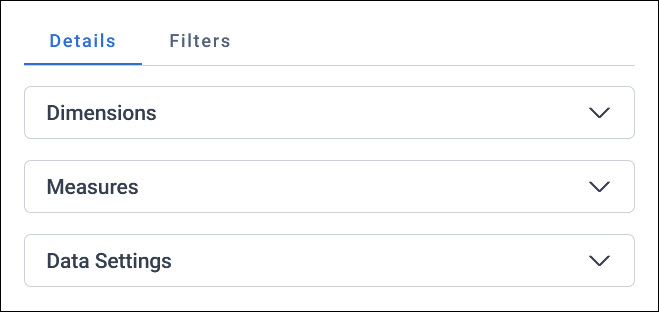
Select Properties, and set up each section on the Details tab:
- Dimensions: What the rows and columns split your audience by. A numeric dimension needs bands, and a date dimension is grouped, such as by year. See Band dates and numbers.
- Measures: The numbers in the cells, such as the number of people or their total spend. Orbit adds a count of the dimension's table for you.
- Data Settings: How the cube counts and limits its data, such as a Value Limit to show only the top or bottom values. See Data Settings.
-
Select Apply.
Above the cube, select Colour Scale to shade the cells by their values.
Note
When a cube has more than one measure, a value limit and the colour scale both use the first measure.
Use an audience as a dimension
In a workbook cube, you can use an audience as a dimension, which you can't do on a dashboard tile. The cube then splits your records into the people who are and aren't in that audience.
To use an audience as a dimension, select + Add Dimension under Dimensions, and choose the audience on the Audiences tab of the data picker.
Example
A cube shows your audience by region and gender. Replace the gender dimension with an audience of people who responded to your last campaign, to see how many people in each region did and didn't respond.
Show percentages or an index
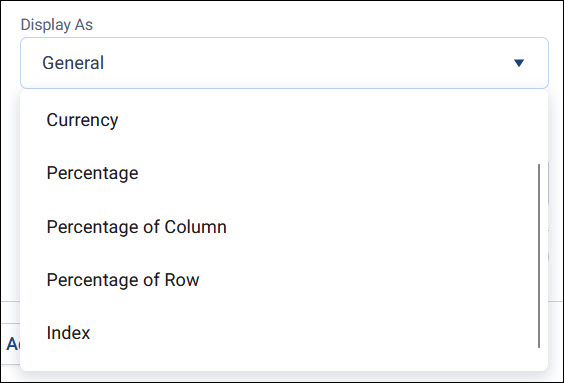
To show each cell as a share of its column or row, change a measure's Display As setting:
- Percentage of Column: Each cell as a percentage of its column total. The cube needs a column dimension.
- Percentage of Row: Each cell as a percentage of its row total
- Index: How each cell's count compares with what you'd expect if the rows and columns were unrelated, where 100 is as expected. See Index in the FastStats help.
Display As also has General, Currency, and Percentage, as on a dashboard tile.
Sorting and filtering columns
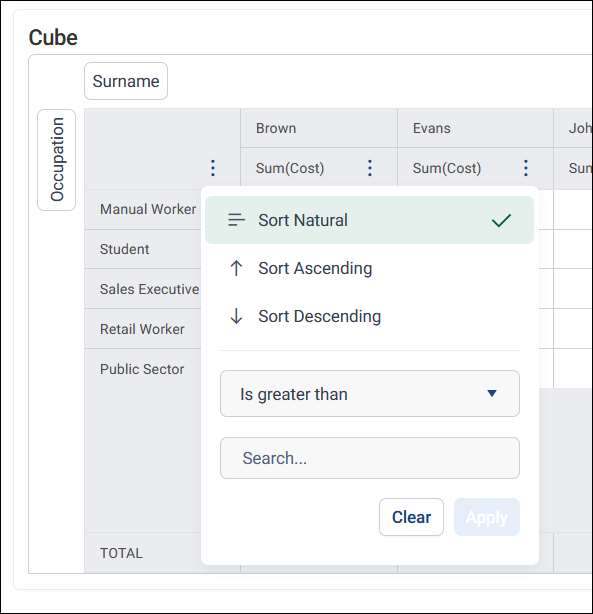
Select a column header's options menu to sort or filter the column.
Sorting applies as soon as you select it. Select Sort Natural to reset a column to its default sort order.
You can filter numeric columns. Choose a comparison, such as Is equal to, Is greater than, or Is less than or equal to, then enter a value. Select Apply, which stays disabled until you enter a value. Selecting Apply applies the filter and closes the menu. Select Clear to reset the filter.
Filtering only affects the data shown on screen. It doesn't change your audience, and isn't applied when you export the cube.
Create an audience from cells
Select cells in a cube to create a new audience of the records in them.
To create an audience from cells:
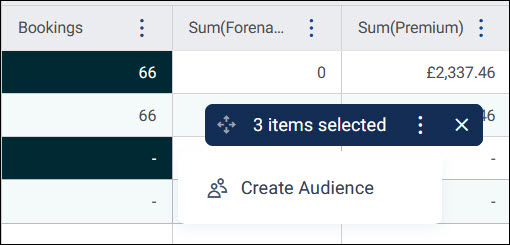
- Select the cells you want. A selection box shows how many you've selected.
-
Expand the options menu on the selection box, and select Create Audience.
-
Enter an Audience Name, and select Create.
Note
If the cube has more than one measure, select from one measure only. If your selection spans more than one measure, Orbit shows Only one measure can be selected at a time.
Export a cube
You can export a cube as a PDF, Excel (XLSX), or text (TXT) file.
To export a cube:
- Open the page's options menu, and select Export.
- Enter a File Name, and choose a File Format.
-
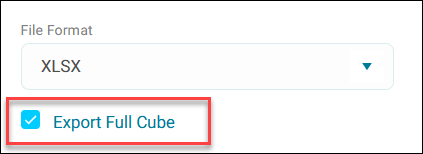
To export every value, including any a value limit or category limit hides, select Export Full Cube. Use XLSX or TXT for this.
-
Check the Preview, and select Export.
Without Export Full Cube, the file holds only what the cube shows. To export a cube tile on a dashboard, see Export a dashboard tile.