Charts
A chart page shows your audience's records as a full-screen chart. It works in the same way as a chart tile on a dashboard, with the same chart types, dimensions, and measures. This page covers what's different in a workbook.
Add a chart page
You choose the chart type, then its dimensions and measures, in the page's Properties panel.
To add a chart page:
- Select + New Page, and name the page.
- Under Tools, select Chart.
- Select Properties.
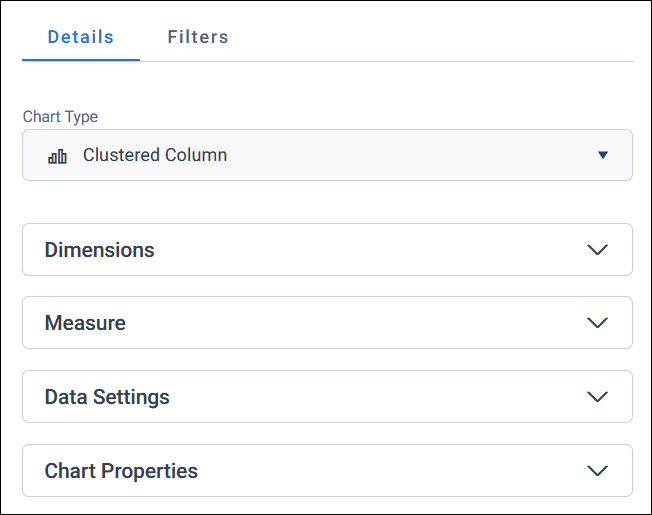
- On the Details tab, choose a Chart Type. Single dimension charts need one dimension and multi dimension charts need two. Combo charts need two measures.
-
Set up each section:
- Dimensions: What the chart splits your audience by, such as region
- Measure: The numbers the chart shows, such as the number of people. Orbit adds a count of the dimension's table for you.
- Data Settings: How the chart counts and limits its data. See Data Settings.
- Chart Properties: Turn on Legend to show a legend, and enter a Legend Title
-
Select Apply.
For which chart type suits your data, see Single dimension charts and Multi dimension charts.
Create an audience from a chart
Select part of a chart, such as some columns or points on a line, to create a new audience of the records they represent.
To create an audience from a chart:
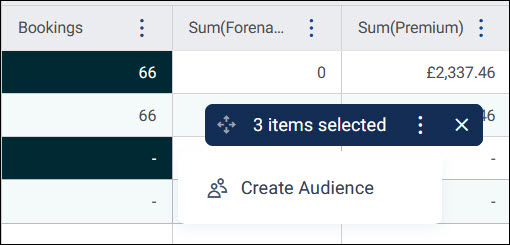
- Select the parts of the chart you want. A selection box shows how many you've selected.
-
Expand the options menu on the selection box, and select Create Audience.
-
Enter an Audience Name, and select Create.
Note
If the chart has more than one measure, select from one measure only. If your selection spans more than one measure, Orbit shows Only one measure can be selected at a time.
Example
A line chart shows people by the month they first gave. Select the first three months of the year, and create an audience of the people who started giving in those months.