Maps
A map page shades each area of a map, such as UK postal districts, by your audience's records. It uses the same map definitions as a map tile on a dashboard. This page covers what's different in a workbook.
Before you begin
You can only choose maps your administrator has set up as map definitions.
Add a map page
You choose the map, and what it's shaded by, in the page's Properties panel.
To add a map page:
- Select + New Page, and name the page.
- Under Tools, select Map.
-
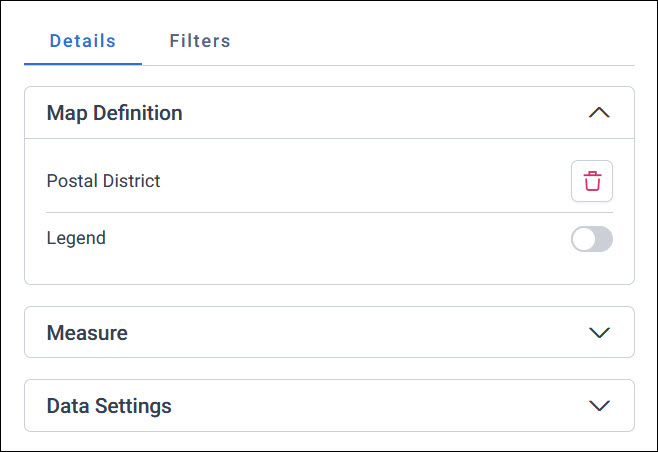
Select Properties, and set up each section on the Details tab:
- Map Definition: The map to show, such as Postal District. Turn on Legend to show what each shade means.
- Measure: What each area is shaded by, such as the number of people. Orbit adds a count of the map's table for you.
- Data Settings: How the map counts and limits its data. See Data Settings.
-
Select Apply.
The map has a background map from OpenStreetMap, and you can zoom in and out and move around it.
Tip
To map your whole database, tick Include all People (or your table level) on the Audience tab, instead of adding filters. This also makes a useful base before you create a penetration map.
Shade the map
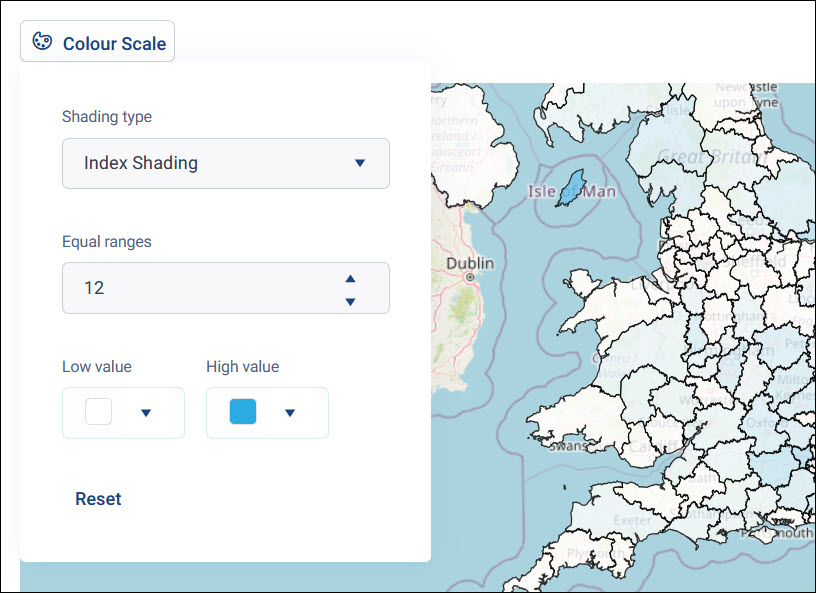
Select Colour Scale on the map to choose how it's shaded:
- Shading type: Quantiles splits the areas into groups of the same size, so a few unusually large or small areas don't dominate the map. Index Shading compares each area with what you'd expect. See Create a penetration map.
- Equal ranges: How many shades to use
- Low value and High value: The colours for the lowest and highest values
Select Reset to go back to the default shading.
Create a penetration map
A penetration map shows where your audience is concentrated, compared with everyone in your system. Areas where your audience is more common than you'd expect are darker.
To create a penetration map:
- Build your audience, such as people who've booked a holiday to Sweden, and add a map page.
- Select Colour Scale, and change Shading type to Index Shading.
-
Set the Equal ranges either side of the index, and the Low value and High value colours.
Use a penetration map to focus your marketing on the areas where people like your audience are most common.