Map tiles
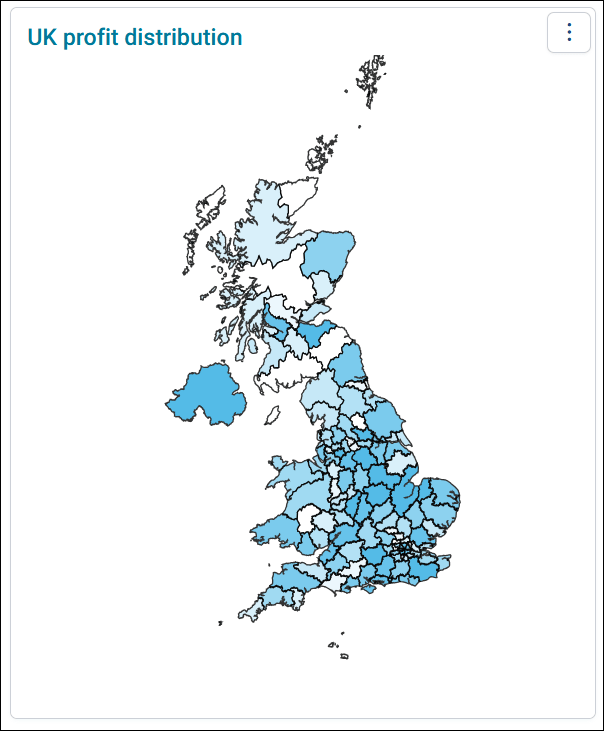
A map tile shades each area, such as a UK postal sector, by a measure, such as the number of people who live there. Use it to see where your supporters or customers are, and to select areas to filter your dashboard by.
Before you begin
The maps you can choose are the map definitions your administrator has set up. They can come from Apteco's boundary map files, or from your own shape files:
- Standard boundary maps: UK postal areas, German and Swiss 2 digit postcodes, Dutch provinces and municipalities, US states, and a world map
- Detailed UK postcode maps: UK postal areas, districts, and sectors. These need the detailed UK postcodes add-on.
If you can't choose the map you need, ask your administrator to install the boundary map files.
Add a map tile
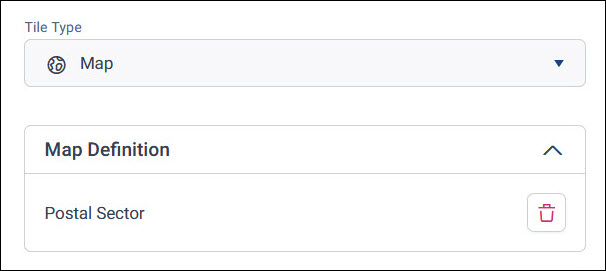
A map tile has a Map Definition section in place of dimensions, where you choose the map.
To add a map tile:
- With your dashboard in edit mode, add a new tile, and select Map as its Tile Type.
-
Under Map Definition, choose a map in the data picker. Only map definitions are available to choose.
-
Under Measure, check what the map is shaded by. Orbit adds a count of the map's table, such as Households, as the default measure. To shade by something else, such as the number of people, remove it and add your own measure.
- Select Apply.
Tip
Make your map tile large enough for viewers to tell the areas apart, especially for small areas such as postal sectors.
Change how the map looks
The map's settings are in the tile editor:
- Colour Scale, in Data Settings: How the map shades each area, from the low value colour to the high value colour
- Value Limit, in Data Settings: Shows only the top or bottom values
- Background Layer, in Data Settings: Shows a map background under your data, and turns on pan and zoom
- Legend, in Tile Settings: Shows what each shade means
Pan and zoom
With pan and zoom, you can move around a map and zoom in on an area, for a closer look before you select areas to filter by. You can keep your pan and zoom when you filter the dashboard in view mode.
Before you pan and zoom
To pan and zoom on a map tile, you need:
- An Analyser bundle licence or above
- Background Layer turned on for the tile. Only a dashboard editor can turn it on or off: in the tile editor, expand Data Settings and select the Background Layer toggle.
Pan around a map
To pan around a map:
- Select the directional icon on the map.
- Drag the map to move around it.
- When you've finished, select the directional icon again. You can then move the tile on the dashboard as usual.
Zoom in and out
To zoom, select the + icon on the map to zoom in, and the - icon to zoom out.
Maps in audience workbooks
You can also add a map as a full-screen page in an audience workbook, and shade it to show where your audience is concentrated. See Maps.