Data grid tiles
A data grid shows individual or groups of records on a dashboard. It lets you choose a table, and columns from that table and its parents.
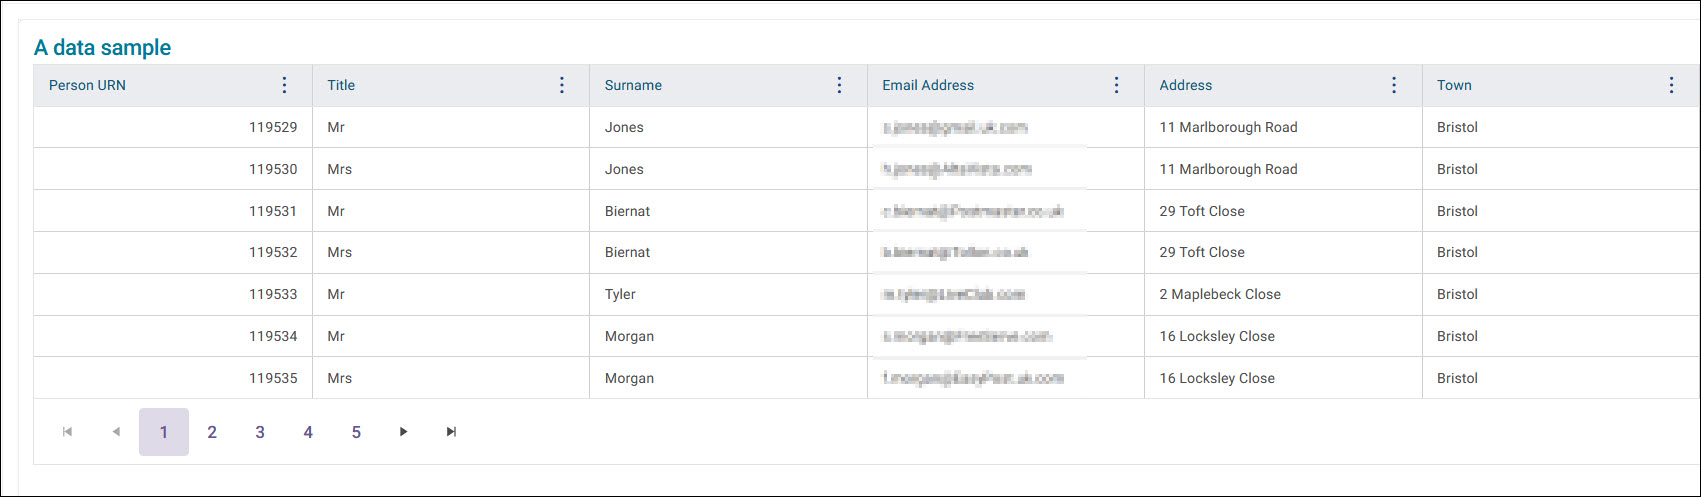
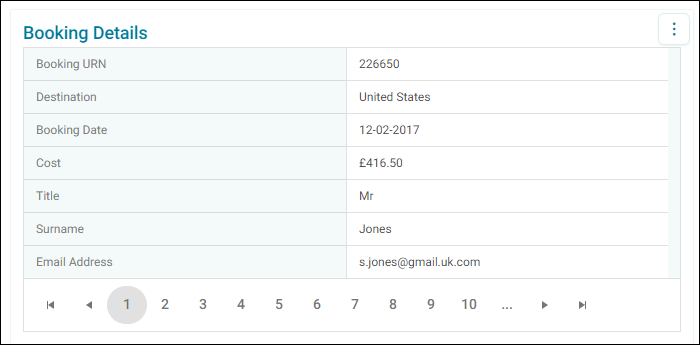
You can view the results as a grid view or a page view.
- Grid view works well for multiple records
- Page view works well for single records
You can select multiple records, and filter, sort, and search the rows and columns.
Creating a new data grid tile
To add a data grid tile to your dashboard:
-
Make sure your dashboard is in edit mode, then select + Add Tile.
-
Select Data Grid from the Tile type dropdown.
-
Select + Add Column.
-
Choose your variables, behaviours, or use an expression, then select Add.
-
Give each column a title.
-
Select Apply.
Orbit adds one column by default, and you can add and remove subsequent columns. You can choose whether to show codes or descriptions for the data in these columns, if the data supports that.
Data settings
Under Data Settings on the tile editor, you can configure:
- Select Via: the table your data grid uses
- Number Of Rows: how many rows to load into the grid at once
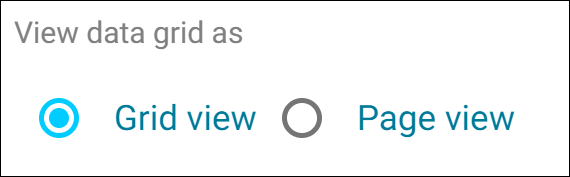
You can also choose to view the data as a Grid view or a Page view.
Grid view
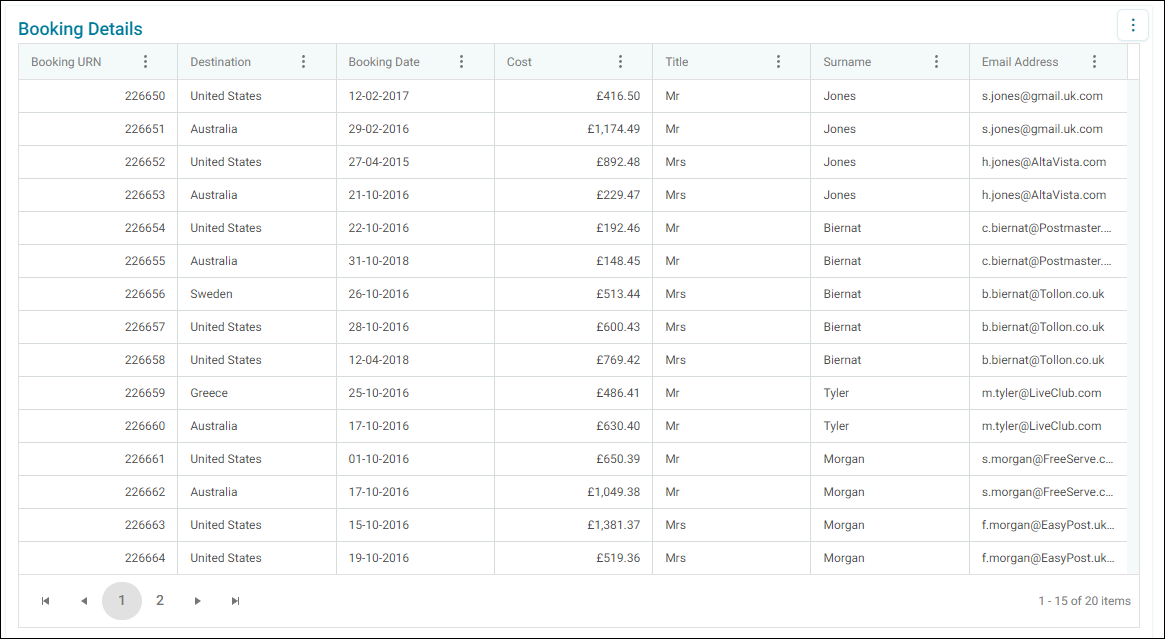
A Grid view shows multiple rows of data.
Page view
A Page view shows one record per page.
Sorting and filtering columns
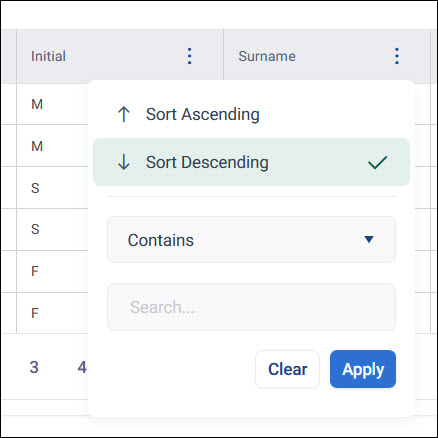
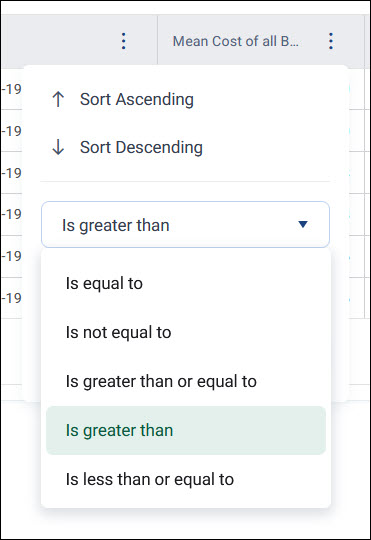
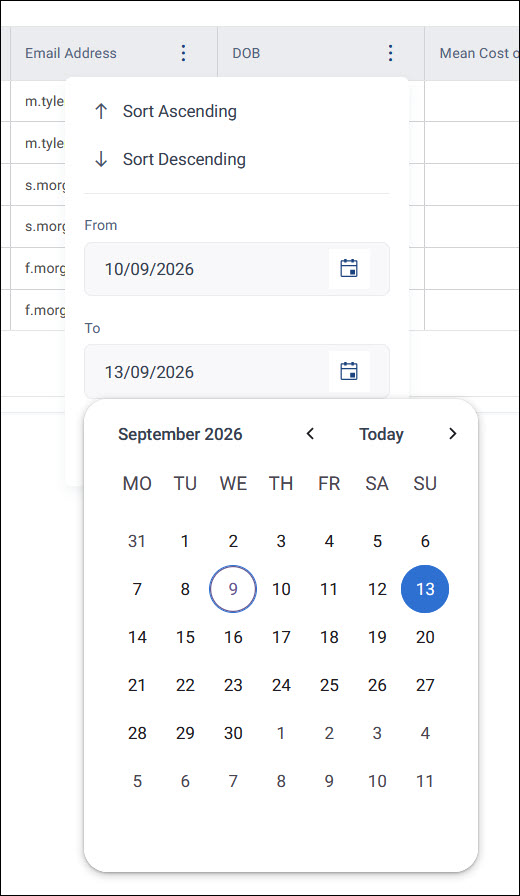
Select a column header's options menu to sort the column, and to filter it if it's a text, numeric, or date column.
-
Text: filter by Contains or Does not contain, then enter your search text
-
Numeric: filter using a comparison such as Is equal to, Is not equal to, Is greater than, Is greater than or equal to, Is less than, or Is less than or equal to, then enter a value
-
Date: filter using a From and To date range
Sorting applies as soon as you select it, or select Sort Natural to reset a column to its default sort order.
For a filter, enter your criteria, then select Apply, which stays disabled until you enter a value. Selecting Apply applies the filter and closes the menu. Select Clear to reset the filter.
Note
Sorting and filtering columns works the same way when a data grid is used as a page in an audience workbook.
You can export the records to PDF or Excel. Select Export Chart from the options menu.