Analysing a dashboard tile
Analysing a tile launches a full-screen version of it as a page in an audience workbook, where you can interact with it in more detail. From here, you can change the tile's settings, add new pages, and continue building out your analysis.
The option's name matches the tile type you're analysing: Analyse Chart for charts, Analyse Cube for cubes, and Analyse Data Grid for data grids. The functionality is otherwise the same across tile types.
To analyse a tile:
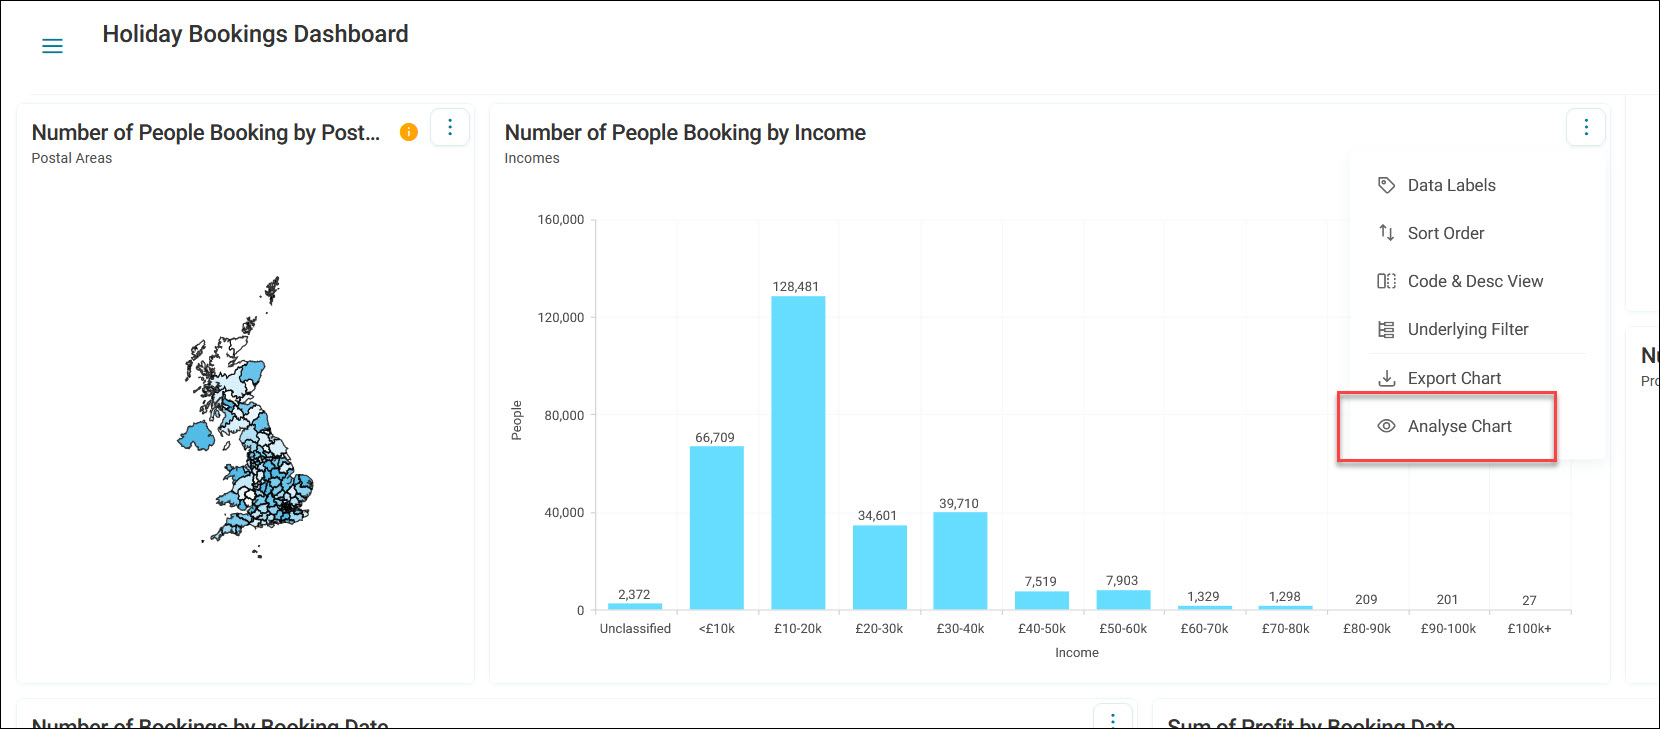
- Click the option menu on your tile.
-
Click Analyse Chart, Analyse Cube, or Analyse Data Grid, depending on the tile type.
-
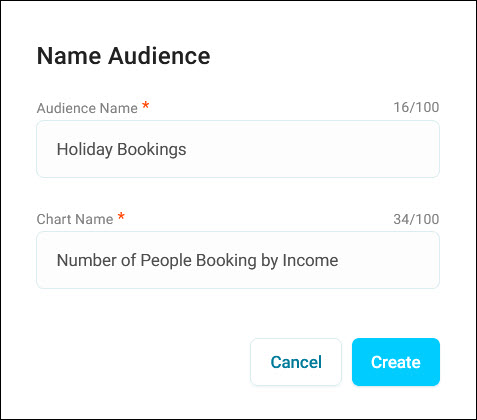
In the Name Audience dialogue, edit the Audience Name and Chart Name as required.
-
Click Create.
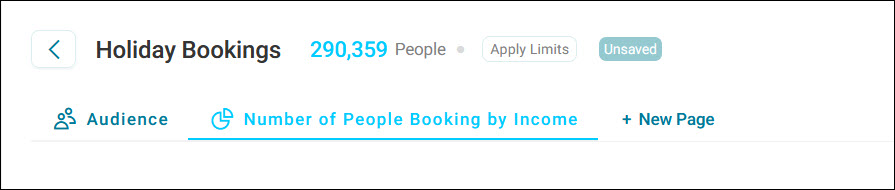
Orbit opens a new audience with a new workbook tab using the names you set. The new page is created with the same visualisation as the tile, and any filters currently applied to the tile carry over to the new page.
Analysing a data grid
Analysing a data grid gives you access to the full range of data grid export functionality available in audience workbooks, including adding, removing, reordering, and licensing columns, and all available export options. See Export data solution.
Note
Analysing a tile is different from exporting it. Analysing a tile opens it for further interactive analysis in a workbook, while exporting a tile downloads a PDF, PNG, or SVG file of the tile as it currently appears.